Clothing and accessories retailer Urban Outfitters (NASDAQ: URBN) reported revenue ahead of Wall Street’s expectations in Q2 CY2025, with sales up 11.3% year on year to $1.5 billion. Its GAAP profit of $1.58 per share was 7.9% above analysts’ consensus estimates.
Is now the time to buy Urban Outfitters? Find out by accessing our full research report, it’s free.
Urban Outfitters (URBN) Q2 CY2025 Highlights:
- Revenue: $1.5 billion vs analyst estimates of $1.48 billion (11.3% year-on-year growth, 1.9% beat)
- EPS (GAAP): $1.58 vs analyst estimates of $1.46 (7.9% beat)
- Adjusted EBITDA: $156.3 million vs analyst estimates of $204.9 million (10.4% margin, 23.7% miss)
- Operating Margin: 11.6%, in line with the same quarter last year
- Free Cash Flow Margin: 10.4%, up from 3.5% in the same quarter last year
- Same-Store Sales rose 5.6% year on year (2% in the same quarter last year)
- Market Capitalization: $6.84 billion
“We are proud to announce record revenues, profits, and earnings per share for the quarter,” said Richard A. Hayne, Chief Executive Officer.
Company Overview
Founded as a purveyor of vintage items, Urban Outfitters (NASDAQ: URBN) now largely sells new apparel and accessories to teens and young adults seeking on-trend fashion.
Revenue Growth
A company’s long-term sales performance can indicate its overall quality. Even a bad business can shine for one or two quarters, but a top-tier one grows for years.
With $5.83 billion in revenue over the past 12 months, Urban Outfitters is a mid-sized retailer, which sometimes brings disadvantages compared to larger competitors benefiting from better economies of scale.
As you can see below, Urban Outfitters’s sales grew at a tepid 6.8% compounded annual growth rate over the last six years (we compare to 2019 to normalize for COVID-19 impacts), but to its credit, it opened new stores and increased sales at existing, established locations.
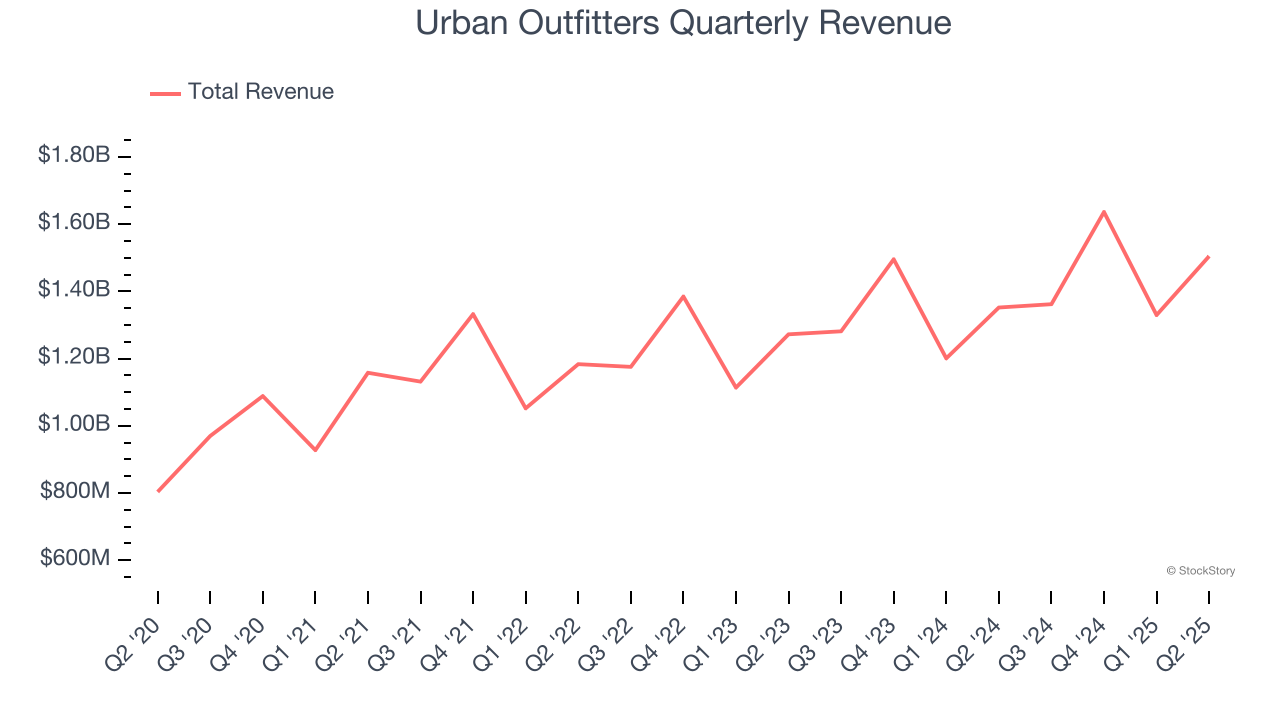
This quarter, Urban Outfitters reported year-on-year revenue growth of 11.3%, and its $1.5 billion of revenue exceeded Wall Street’s estimates by 1.9%.
Looking ahead, sell-side analysts expect revenue to grow 7% over the next 12 months, similar to its six-year rate. This projection is commendable and suggests the market sees success for its products.
Here at StockStory, we certainly understand the potential of thematic investing. Diverse winners from Microsoft (MSFT) to Alphabet (GOOG), Coca-Cola (KO) to Monster Beverage (MNST) could all have been identified as promising growth stories with a megatrend driving the growth. So, in that spirit, we’ve identified a relatively under-the-radar profitable growth stock benefiting from the rise of AI, available to you FREE via this link.
Store Performance
Number of Stores
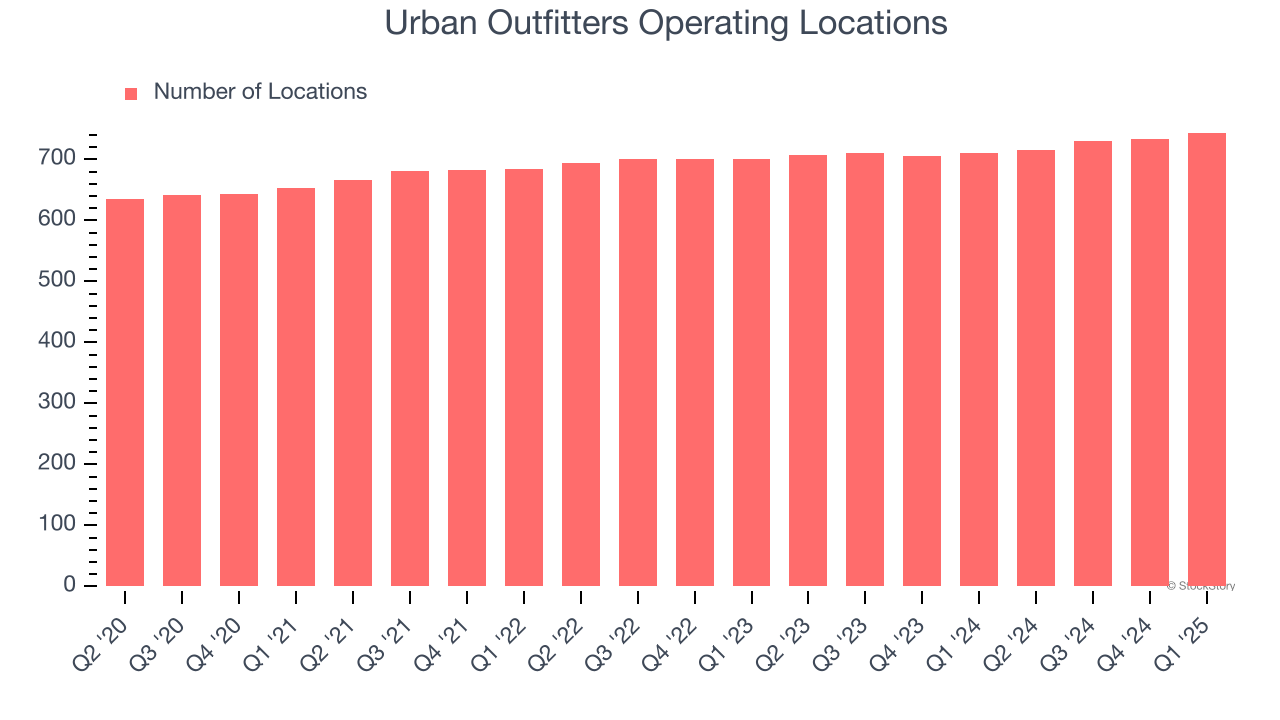
A retailer’s store count often determines how much revenue it can generate.
Over the last two years, Urban Outfitters opened new stores quickly, averaging 2.3% annual growth. This was faster than the broader consumer retail sector.
When a retailer opens new stores, it usually means it’s investing for growth because demand is greater than supply, especially in areas where consumers may not have a store within reasonable driving distance.
Note that Urban Outfitters reports its store count intermittently, so some data points are missing in the chart below.
Same-Store Sales
The change in a company's store base only tells one side of the story. The other is the performance of its existing locations and e-commerce sales, which informs management teams whether they should expand or downsize their physical footprints. Same-store sales is an industry measure of whether revenue is growing at those existing stores and is driven by customer visits (often called traffic) and the average spending per customer (ticket).
Urban Outfitters’s demand has been spectacular for a retailer over the last two years. On average, the company has increased its same-store sales by an impressive 4.3% per year. This performance suggests its rollout of new stores is beneficial for shareholders. We like this backdrop because it gives Urban Outfitters multiple ways to win: revenue growth can come from new stores, e-commerce, or increased foot traffic and higher sales per customer at existing locations.
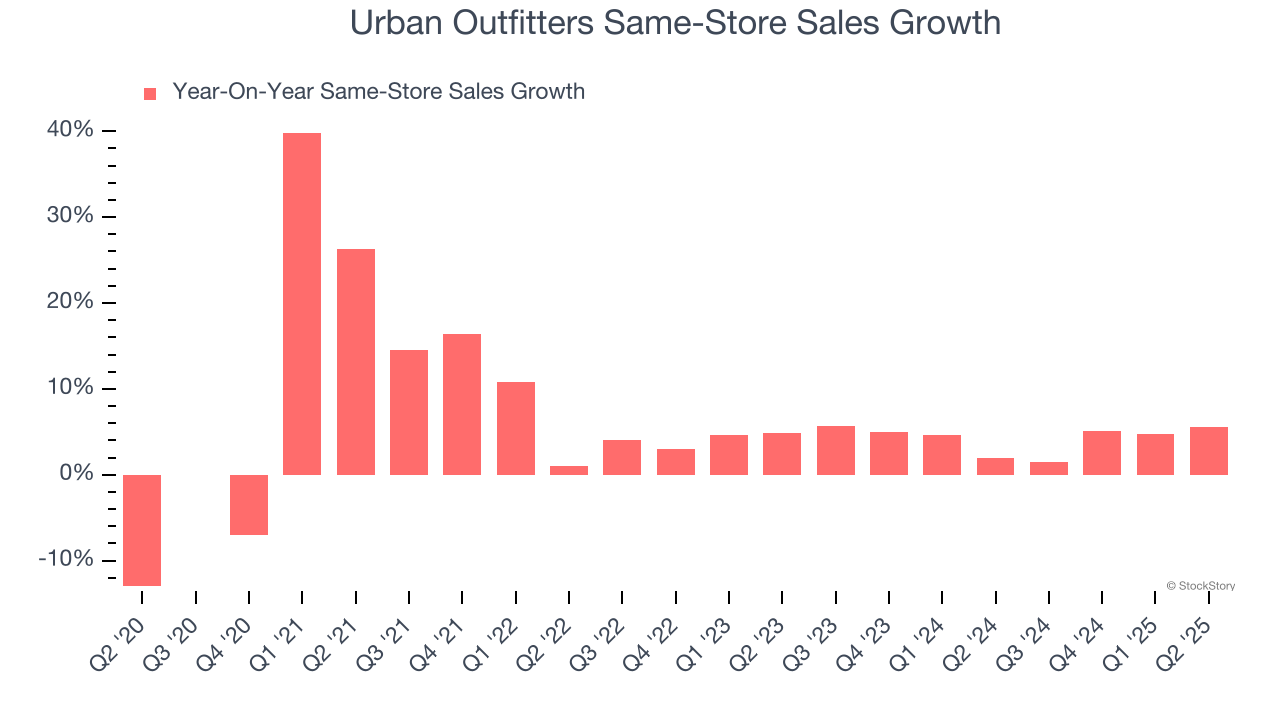
In the latest quarter, Urban Outfitters’s same-store sales rose 5.6% year on year. This growth was an acceleration from its historical levels, which is always an encouraging sign.
Key Takeaways from Urban Outfitters’s Q2 Results
It was encouraging to see Urban Outfitters beat analysts’ revenue and EPS expectations this quarter. On the other hand, its EBITDA missed. Overall, this was a weaker quarter. The stock traded down 7.1% to $72.55 immediately following the results.
Big picture, is Urban Outfitters a buy here and now? We think that the latest quarter is only one piece of the longer-term business quality puzzle. Quality, when combined with valuation, can help determine if the stock is a buy. We cover that in our actionable full research report which you can read here, it’s free.