Personal care and home fragrance retailer Bath & Body Works (NYSE: BBWI) met Wall Street’s revenue expectations in Q2 CY2025, with sales up 1.5% year on year to $1.55 billion. The company expects next quarter’s revenue to be around $1.64 billion, close to analysts’ estimates. Its GAAP profit of $0.30 per share was 19.3% below analysts’ consensus estimates.
Is now the time to buy Bath and Body Works? Find out by accessing our full research report, it’s free.
Bath and Body Works (BBWI) Q2 CY2025 Highlights:
- Revenue: $1.55 billion vs analyst estimates of $1.55 billion (1.5% year-on-year growth, in line)
- EPS (GAAP): $0.30 vs analyst expectations of $0.37 (19.3% miss)
- Revenue Guidance for Q3 CY2025 is $1.64 billion at the midpoint, roughly in line with what analysts were expecting
- EPS (GAAP) guidance for Q3 CY2025 is $0.41 at the midpoint, missing analyst estimates by 17.2%
- Operating Margin: 10.1%, down from 12% in the same quarter last year
- Locations: 2,441 at quarter end, up from 2,369 in the same quarter last year
- Market Capitalization: $6.67 billion
Company Overview
Spun off from L Brands in 2020, Bath & Body Works (NYSE: BBWI) is a personal care and home fragrance retailer where consumers can find specialty shower gels, scented candles for the home, and lotions.
Revenue Growth
Examining a company’s long-term performance can provide clues about its quality. Any business can have short-term success, but a top-tier one grows for years.
With $7.37 billion in revenue over the past 12 months, Bath and Body Works is a mid-sized retailer, which sometimes brings disadvantages compared to larger competitors benefiting from better economies of scale.
As you can see below, Bath and Body Works’s sales grew at a tepid 6.5% compounded annual growth rate over the last six years (we compare to 2019 to normalize for COVID-19 impacts).
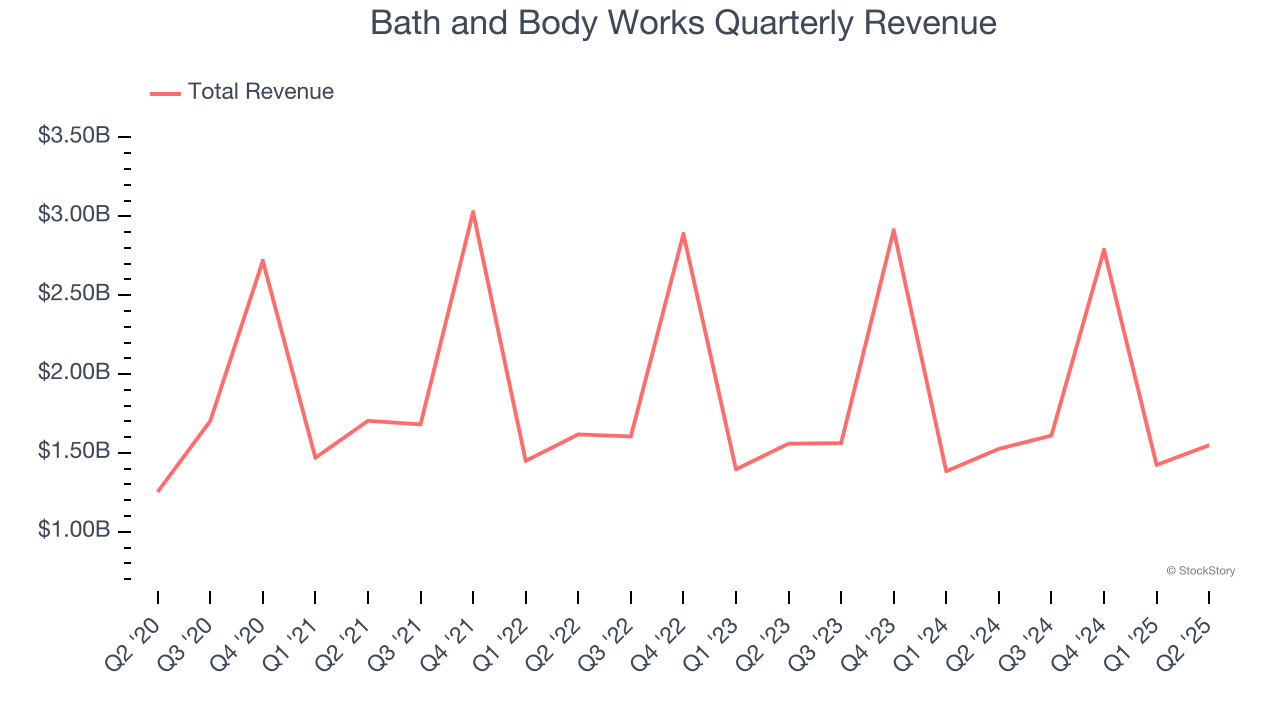
This quarter, Bath and Body Works grew its revenue by 1.5% year on year, and its $1.55 billion of revenue was in line with Wall Street’s estimates. Company management is currently guiding for a 2% year-on-year increase in sales next quarter.
Looking further ahead, sell-side analysts expect revenue to grow 2.4% over the next 12 months, a deceleration versus the last six years. This projection doesn't excite us and suggests its products will see some demand headwinds.
Today’s young investors won’t have read the timeless lessons in Gorilla Game: Picking Winners In High Technology because it was written more than 20 years ago when Microsoft and Apple were first establishing their supremacy. But if we apply the same principles, then enterprise software stocks leveraging their own generative AI capabilities may well be the Gorillas of the future. So, in that spirit, we are excited to present our Special Free Report on a profitable, fast-growing enterprise software stock that is already riding the automation wave and looking to catch the generative AI next.
Store Performance
Number of Stores
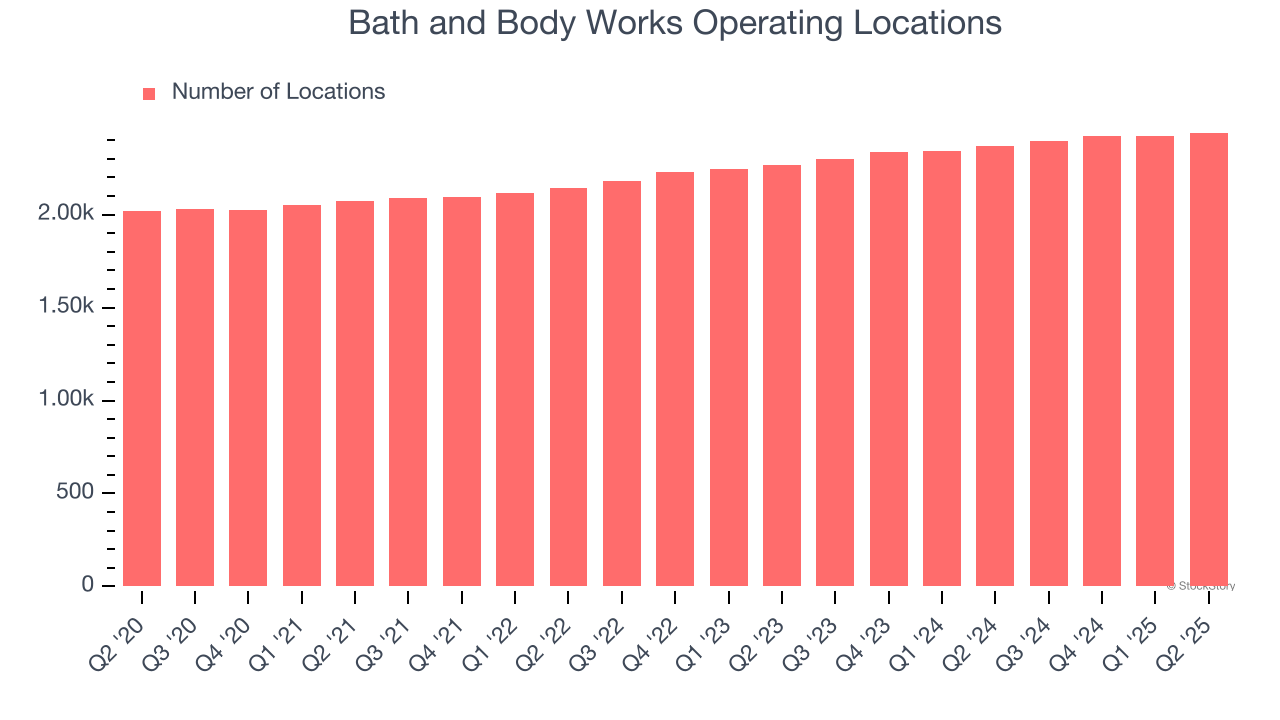
The number of stores a retailer operates is a critical driver of how quickly company-level sales can grow.
Bath and Body Works operated 2,441 locations in the latest quarter. It has opened new stores at a rapid clip over the last two years, averaging 4.2% annual growth, much faster than the broader consumer retail sector. This gives it a chance to become a large, scaled business over time.
When a retailer opens new stores, it usually means it’s investing for growth because demand is greater than supply, especially in areas where consumers may not have a store within reasonable driving distance.
Same-Store Sales
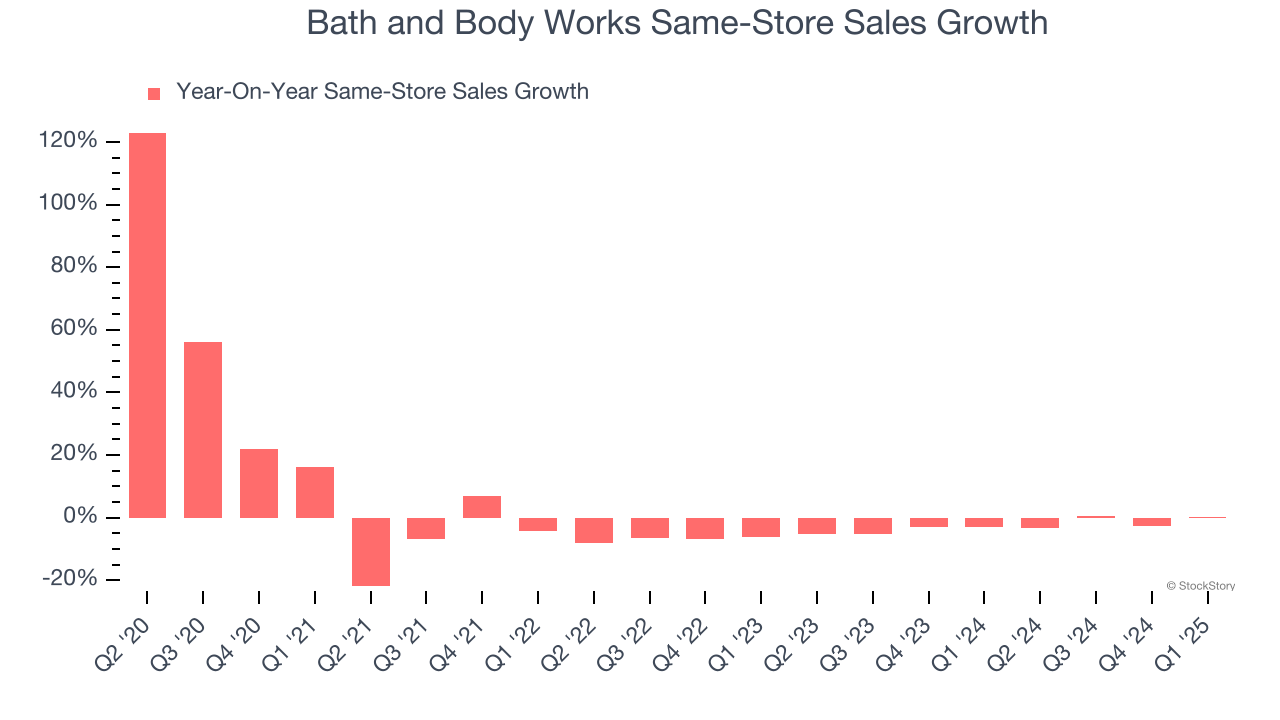
The change in a company's store base only tells one side of the story. The other is the performance of its existing locations and e-commerce sales, which informs management teams whether they should expand or downsize their physical footprints. Same-store sales provides a deeper understanding of this issue because it measures organic growth at brick-and-mortar shops for at least a year.
Bath and Body Works’s demand has been shrinking over the last two years as its same-store sales have averaged 2.4% annual declines. This performance is concerning - it shows Bath and Body Works artificially boosts its revenue by building new stores. We’d like to see a company’s same-store sales rise before it takes on the costly, capital-intensive endeavor of expanding its store base.
Note that Bath and Body Works reports its same-store sales intermittently, so some data points are missing in the chart below.
Key Takeaways from Bath and Body Works’s Q2 Results
We struggled to find many positives in these results. Its EPS guidance for next quarter missed and its EPS fell short of Wall Street’s estimates. Overall, this was a weaker quarter. The stock remained flat at $31.37 immediately following the results.
Bath and Body Works may have had a tough quarter, but does that actually create an opportunity to invest right now? What happened in the latest quarter matters, but not as much as longer-term business quality and valuation, when deciding whether to invest in this stock. We cover that in our actionable full research report which you can read here, it’s free.