Discount retailer Dollar General (NYSE: DG) reported Q2 CY2025 results beating Wall Street’s revenue expectations, with sales up 5.1% year on year to $10.73 billion. Its GAAP profit of $1.86 per share was 18.5% above analysts’ consensus estimates.
Is now the time to buy Dollar General? Find out by accessing our full research report, it’s free.
Dollar General (DG) Q2 CY2025 Highlights:
- Revenue: $10.73 billion vs analyst estimates of $10.67 billion (5.1% year-on-year growth, 0.5% beat)
- EPS (GAAP): $1.86 vs analyst estimates of $1.57 (18.5% beat)
- Adjusted EBITDA: $822 million vs analyst estimates of $784.3 million (7.7% margin, 4.8% beat)
- EPS (GAAP) guidance for the full year is $6.05 at the midpoint, beating analyst estimates by 5%
- Operating Margin: 5.6%, in line with the same quarter last year
- Free Cash Flow Margin: 5.3%, similar to the same quarter last year
- Locations: 20,746 at quarter end, up from 20,345 in the same quarter last year
- Same-Store Sales rose 2.8% year on year (0.5% in the same quarter last year)
- Market Capitalization: $24.47 billion
Company Overview
Appealing to the budget-conscious consumer, Dollar General (NYSE: DG) is a discount retailer that sells a wide range of household essentials, groceries, apparel/beauty products, and seasonal merchandise.
Revenue Growth
Examining a company’s long-term performance can provide clues about its quality. Any business can have short-term success, but a top-tier one grows for years.
With $41.65 billion in revenue over the past 12 months, Dollar General is larger than most consumer retail companies and benefits from economies of scale, enabling it to gain more leverage on its fixed costs than smaller competitors. This also gives it the flexibility to offer lower prices. However, its scale is a double-edged sword because there are only a finite number of places to build new stores, making it harder to find incremental growth. To expand meaningfully, Dollar General likely needs to tweak its prices or enter new markets.
As you can see below, Dollar General’s sales grew at a mediocre 7.7% compounded annual growth rate over the last six years (we compare to 2019 to normalize for COVID-19 impacts) as it barely increased sales at existing, established locations.
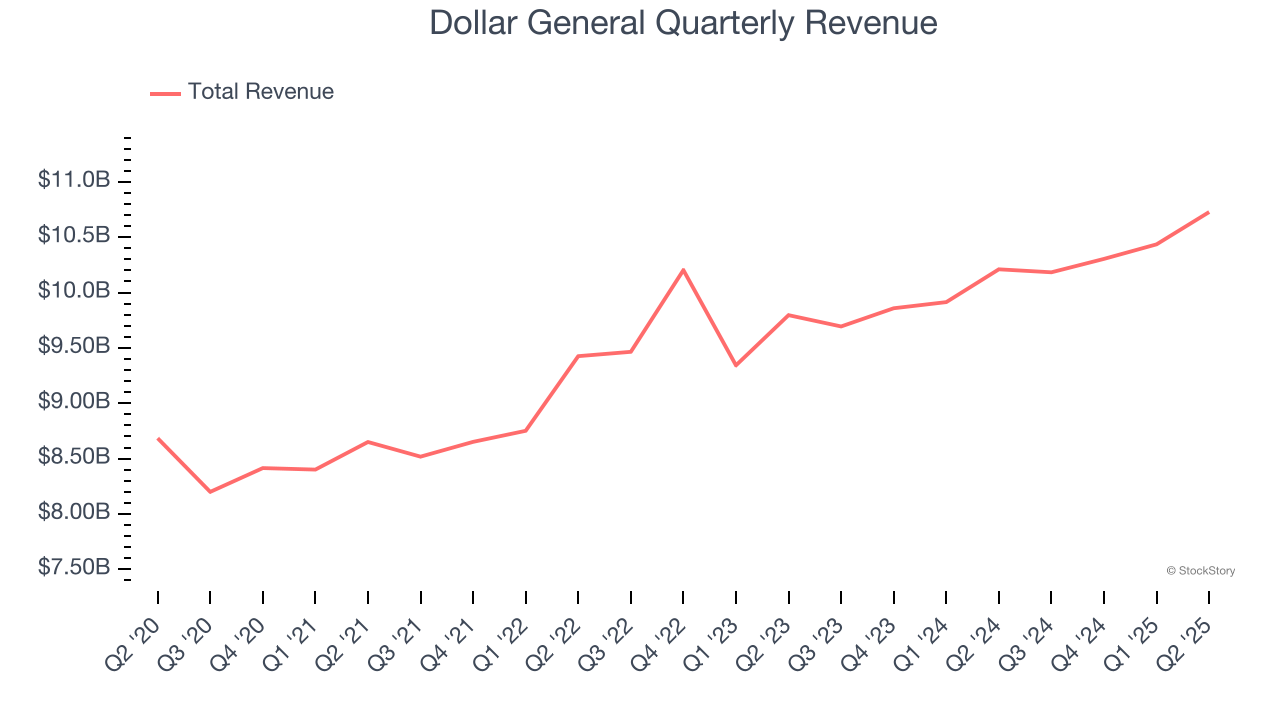
This quarter, Dollar General reported year-on-year revenue growth of 5.1%, and its $10.73 billion of revenue exceeded Wall Street’s estimates by 0.5%.
Looking ahead, sell-side analysts expect revenue to grow 3.9% over the next 12 months, a deceleration versus the last six years. We still think its growth trajectory is satisfactory given its scale and implies the market is baking in success for its products.
Today’s young investors won’t have read the timeless lessons in Gorilla Game: Picking Winners In High Technology because it was written more than 20 years ago when Microsoft and Apple were first establishing their supremacy. But if we apply the same principles, then enterprise software stocks leveraging their own generative AI capabilities may well be the Gorillas of the future. So, in that spirit, we are excited to present our Special Free Report on a profitable, fast-growing enterprise software stock that is already riding the automation wave and looking to catch the generative AI next.
Store Performance
Number of Stores
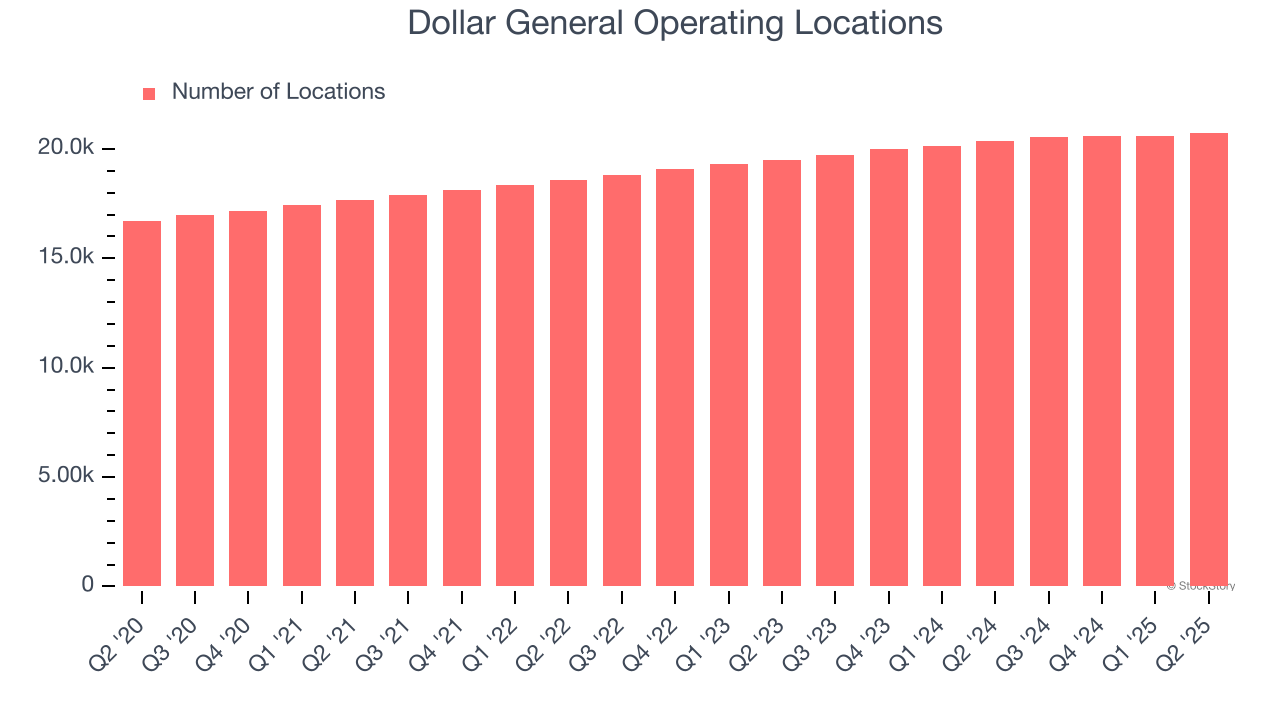
The number of stores a retailer operates is a critical driver of how quickly company-level sales can grow.
Dollar General operated 20,746 locations in the latest quarter. It has opened new stores at a rapid clip over the last two years, averaging 3.7% annual growth, much faster than the broader consumer retail sector.
When a retailer opens new stores, it usually means it’s investing for growth because demand is greater than supply, especially in areas where consumers may not have a store within reasonable driving distance.
Same-Store Sales
A company's store base only paints one part of the picture. When demand is high, it makes sense to open more. But when demand is low, it’s prudent to close some locations and use the money in other ways. Same-store sales provides a deeper understanding of this issue because it measures organic growth at brick-and-mortar shops for at least a year.
Dollar General’s demand within its existing locations has been relatively stable over the last two years but was below most retailers. On average, the company’s same-store sales have grown by 1.3% per year. This performance suggests it should consider improving its foot traffic and efficiency before expanding its store base.
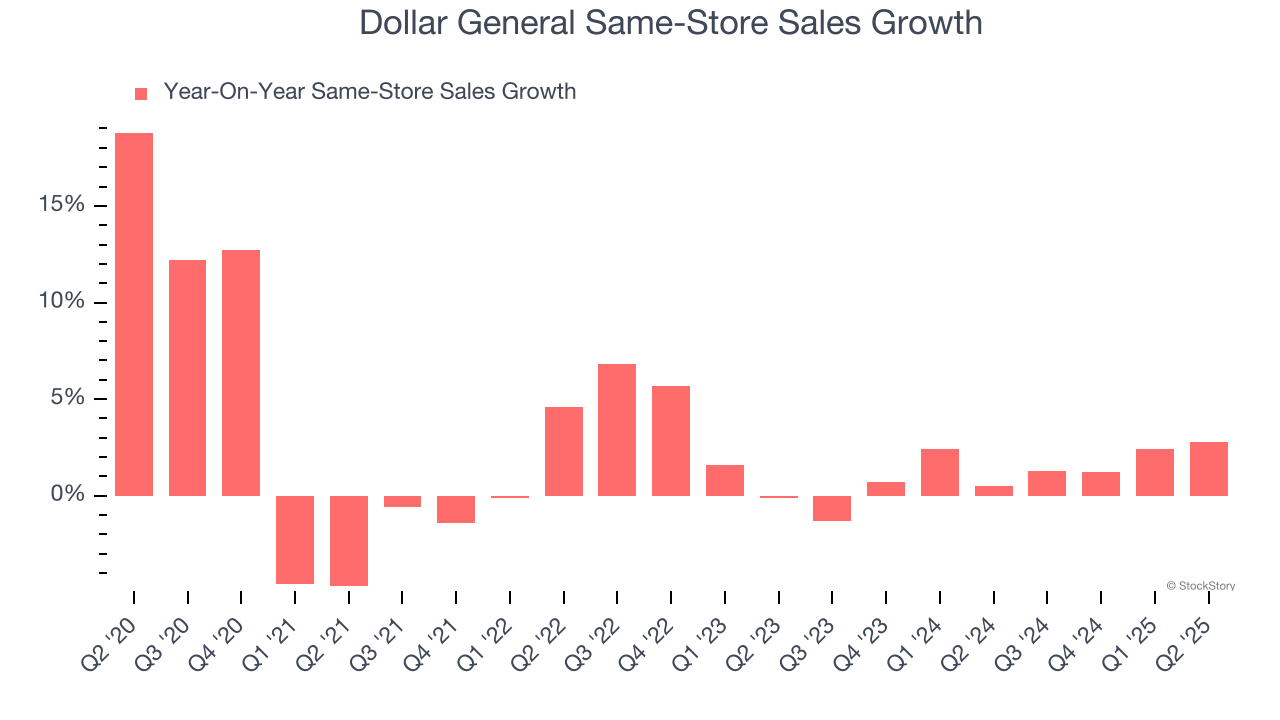
In the latest quarter, Dollar General’s same-store sales rose 2.8% year on year. This growth was an acceleration from its historical levels, which is always an encouraging sign.
Key Takeaways from Dollar General’s Q2 Results
It was great to see Dollar General’s full-year EPS guidance top analysts’ expectations. We were also glad its EBITDA outperformed Wall Street’s estimates. Zooming out, we think this was a solid print. The stock traded up 7.1% to $119.19 immediately after reporting.
Dollar General put up rock-solid earnings, but one quarter doesn’t necessarily make the stock a buy. Let’s see if this is a good investment. What happened in the latest quarter matters, but not as much as longer-term business quality and valuation, when deciding whether to invest in this stock. We cover that in our actionable full research report which you can read here, it’s free.