
Networking chips designer Marvell Technology (NASDAQ: MRVL) met Wall Street’s revenue expectations in Q2 CY2025, with sales up 57.6% year on year to $2.01 billion. On the other hand, next quarter’s revenue guidance of $2.06 billion was less impressive, coming in 1.9% below analysts’ estimates. Its non-GAAP profit of $0.67 per share was in line with analysts’ consensus estimates.
Is now the time to buy Marvell Technology? Find out by accessing our full research report, it’s free.
Marvell Technology (MRVL) Q2 CY2025 Highlights:
- Revenue: $2.01 billion vs analyst estimates of $2.01 billion (57.6% year-on-year growth, in line)
- Adjusted EPS: $0.67 vs analyst estimates of $0.67 (in line)
- Adjusted EBITDA: $527.8 million vs analyst estimates of $784 million (26.3% margin, 32.7% miss)
- Revenue Guidance for Q3 CY2025 is $2.06 billion at the midpoint, below analyst estimates of $2.1 billion
- Adjusted EPS guidance for Q3 CY2025 is $0.74 at the midpoint, above analyst estimates of $0.72
- Operating Margin: 14.5%, up from -7.9% in the same quarter last year
- Free Cash Flow Margin: 20.6%, similar to the same quarter last year
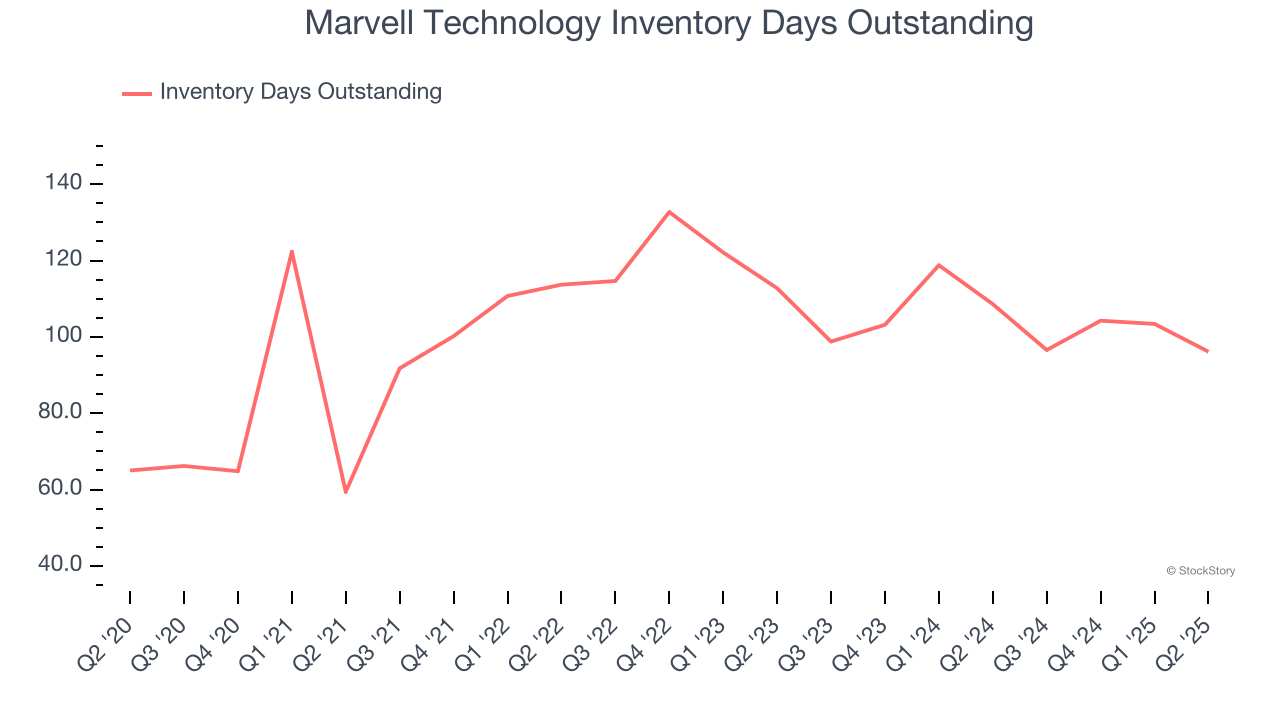
- Inventory Days Outstanding: 96, down from 103 in the previous quarter
- Market Capitalization: $64.48 billion
"Marvell delivered record revenue of $2.006 billion in the second quarter – a 58% year-over-year increase – and we expect continued growth into the third quarter, accompanied by operating margin and earnings per share expansion," said Matt Murphy, Marvell's Chairman and CEO.
Company Overview
Moving away from a low margin storage device management chips in one of the biggest semiconductor business model pivots of the past decade, Marvell Technology (NASDAQ: MRVL) is a fabless designer of special purpose data processing and networking chips used by data centers, communications carriers, enterprises, and autos.
Revenue Growth
A company’s long-term sales performance can indicate its overall quality. Any business can put up a good quarter or two, but many enduring ones grow for years. Over the last five years, Marvell Technology grew its sales at an incredible 20.9% compounded annual growth rate. Its growth beat the average semiconductor company and shows its offerings resonate with customers, a helpful starting point for our analysis. Semiconductors are a cyclical industry, and long-term investors should be prepared for periods of high growth followed by periods of revenue contractions.
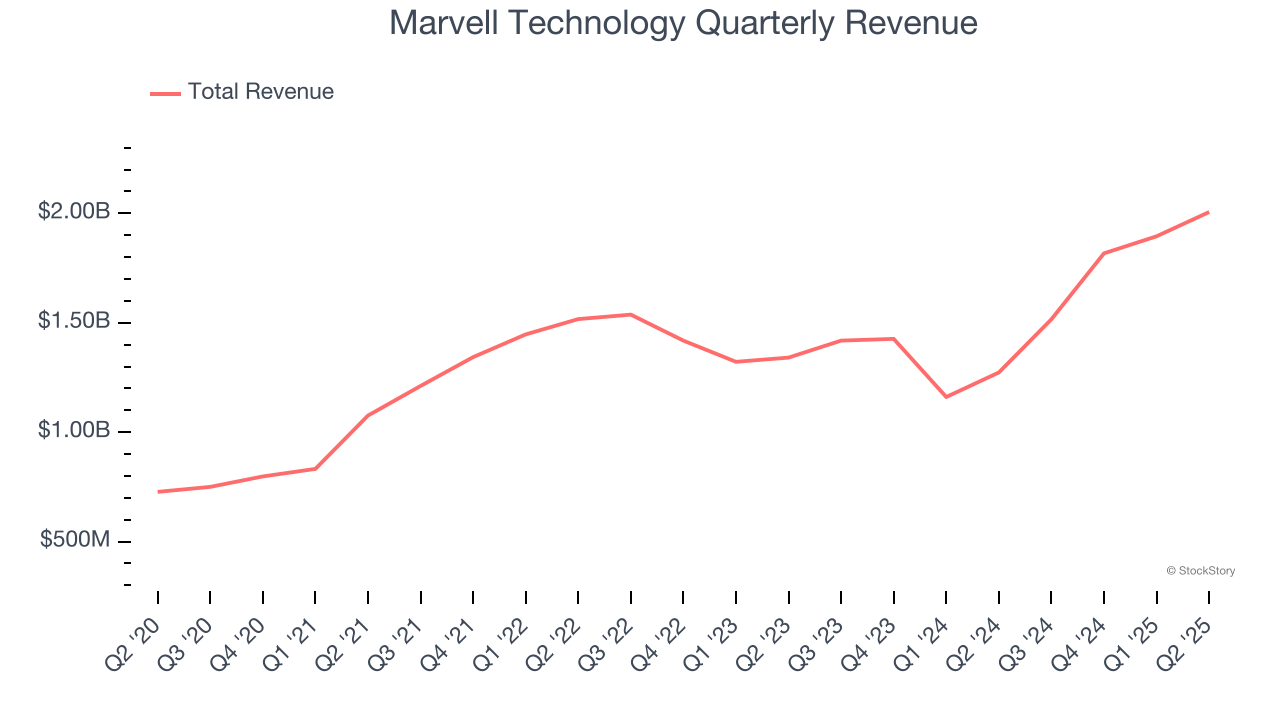
Long-term growth is the most important, but short-term results matter for semiconductors because the rapid pace of technological innovation (Moore's Law) could make yesterday's hit product obsolete today. Marvell Technology’s annualized revenue growth of 13.5% over the last two years is below its five-year trend, but we still think the results suggest healthy demand. 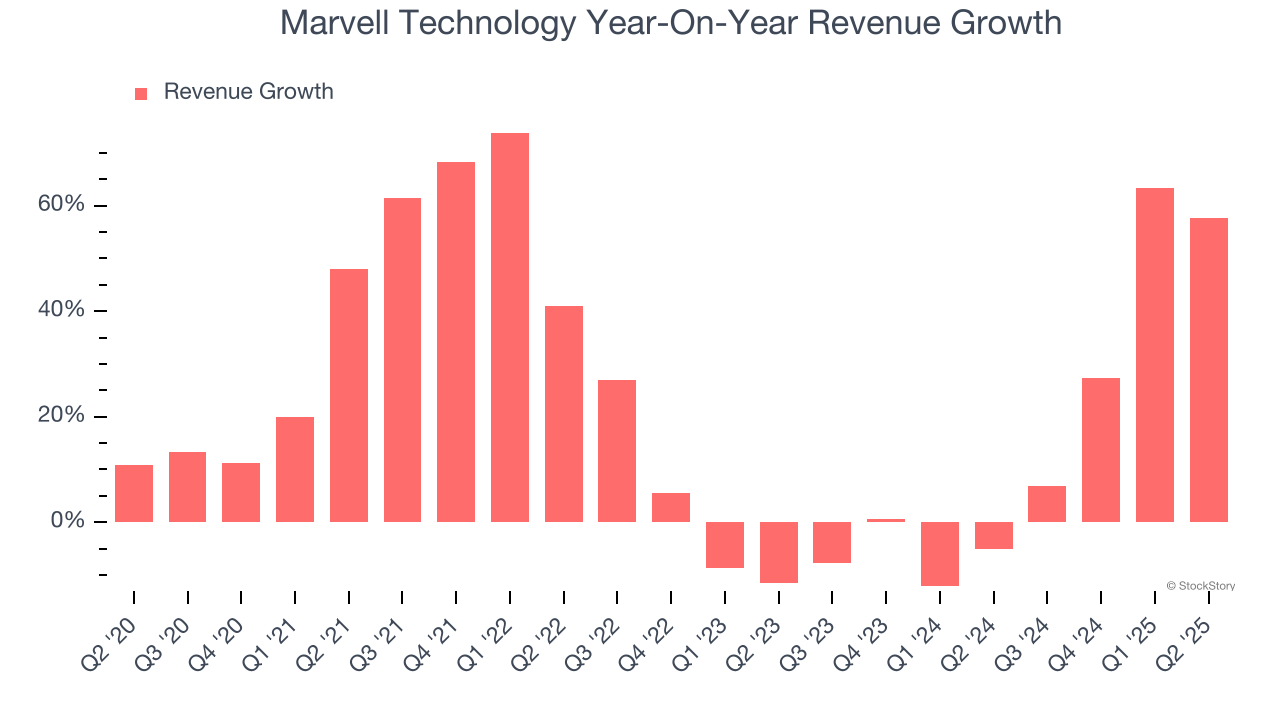
This quarter, Marvell Technology’s year-on-year revenue growth of 57.6% was magnificent, and its $2.01 billion of revenue was in line with Wall Street’s estimates. Beyond meeting estimates, this marks 4 straight quarters of growth, implying that Marvell Technology is in the middle of its cycle - a typical upcycle generally lasts 8-10 quarters. Company management is currently guiding for a 35.9% year-on-year increase in sales next quarter.
Looking further ahead, sell-side analysts expect revenue to grow 23% over the next 12 months, an improvement versus the last two years. This projection is eye-popping and implies its newer products and services will fuel better top-line performance.
Software is eating the world and there is virtually no industry left that has been untouched by it. That drives increasing demand for tools helping software developers do their jobs, whether it be monitoring critical cloud infrastructure, integrating audio and video functionality, or ensuring smooth content streaming. Click here to access a free report on our 3 favorite stocks to play this generational megatrend.
Product Demand & Outstanding Inventory
Days Inventory Outstanding (DIO) is an important metric for chipmakers, as it reflects a business’ capital intensity and the cyclical nature of semiconductor supply and demand. In a tight supply environment, inventories tend to be stable, allowing chipmakers to exert pricing power. Steadily increasing DIO can be a warning sign that demand is weak, and if inventories continue to rise, the company may have to downsize production.
This quarter, Marvell Technology’s DIO came in at 96, which is 6 days below its five-year average. At the moment, these numbers show no indication of an excessive inventory buildup.
Key Takeaways from Marvell Technology’s Q2 Results
It was great to see a material improvement in Marvell Technology’s inventory levels. On the other hand, its revenue guidance for next quarter missed and its revenue was in line with Wall Street’s estimates. Overall, this was a weaker quarter. The stock traded down 8.7% to $70.58 immediately following the results.
Marvell Technology may have had a tough quarter, but does that actually create an opportunity to invest right now? The latest quarter does matter, but not nearly as much as longer-term fundamentals and valuation, when deciding if the stock is a buy. We cover that in our actionable full research report which you can read here, it’s free.


