
Discount retail company Ollie’s Bargain Outlet (NASDAQ: OLLI) reported Q2 CY2025 results exceeding the market’s revenue expectations, with sales up 17.5% year on year to $679.6 million. The company’s full-year revenue guidance of $2.64 billion at the midpoint came in 1.3% above analysts’ estimates. Its non-GAAP profit of $0.99 per share was 6.8% above analysts’ consensus estimates.
Is now the time to buy Ollie's? Find out by accessing our full research report, it’s free.
Ollie's (OLLI) Q2 CY2025 Highlights:
- Revenue: $679.6 million vs analyst estimates of $661.9 million (17.5% year-on-year growth, 2.7% beat)
- Adjusted EPS: $0.99 vs analyst estimates of $0.93 (6.8% beat)
- Adjusted EBITDA: $93.79 million vs analyst estimates of $87.36 million (13.8% margin, 7.4% beat)
- The company lifted its revenue guidance for the full year to $2.64 billion at the midpoint from $2.59 billion, a 1.9% increase
- Management raised its full-year Adjusted EPS guidance to $3.80 at the midpoint, a 2.7% increase
- Operating Margin: 11.3%, in line with the same quarter last year
- Free Cash Flow Margin: 11.9%, up from 1% in the same quarter last year
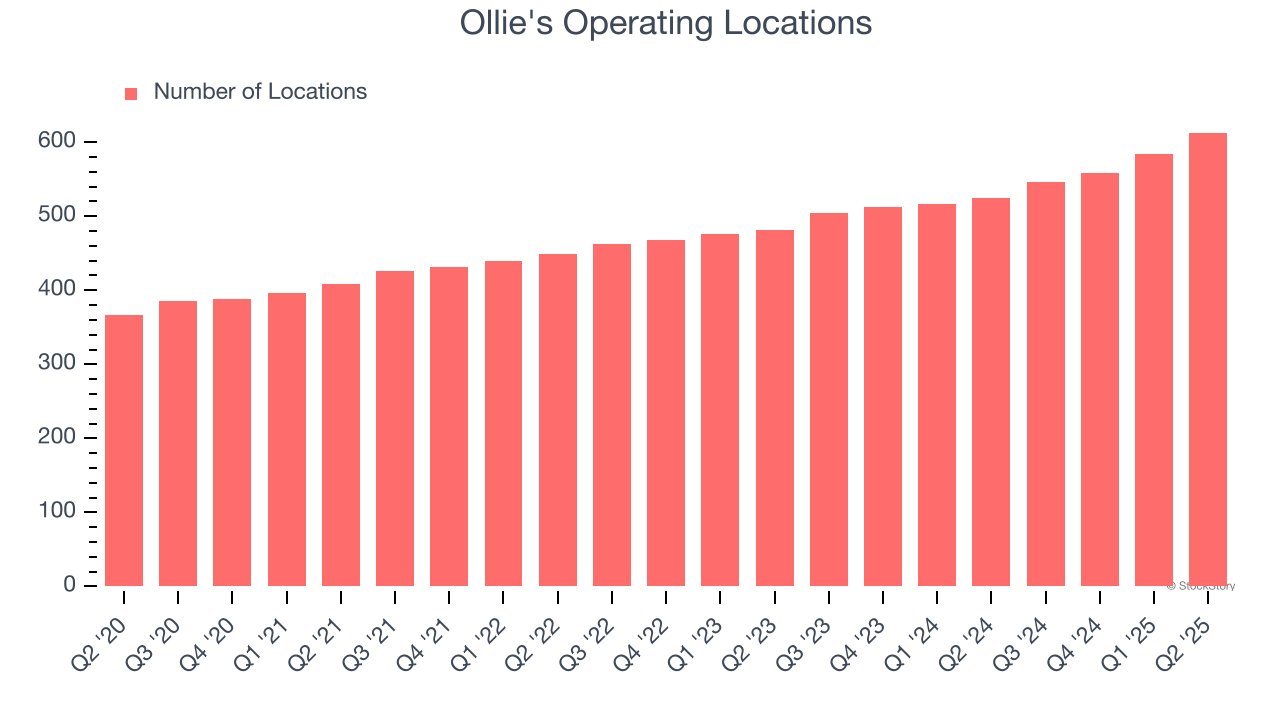
- Locations: 613 at quarter end, up from 525 in the same quarter last year
- Same-Store Sales rose 5% year on year, in line with the same quarter last year
- Market Capitalization: $8.01 billion
“We had a very strong second quarter and are operating with the wind in our sails,” said Eric van der Valk, President and Chief Executive Officer.
Company Overview
Often located in suburban or semi-rural shopping centers, Ollie’s Bargain Outlet (NASDAQ: OLLI) is a discount retailer that acquires excess inventory then sells at meaningful discounts.
Revenue Growth
A company’s long-term performance is an indicator of its overall quality. Any business can put up a good quarter or two, but many enduring ones grow for years.
With $2.44 billion in revenue over the past 12 months, Ollie's is a small retailer, which sometimes brings disadvantages compared to larger competitors benefiting from economies of scale and negotiating leverage with suppliers. On the bright side, it can grow faster because it has more white space to build new stores.
As you can see below, Ollie’s 10.6% annualized revenue growth over the last six years (we compare to 2019 to normalize for COVID-19 impacts) was decent as it opened new stores and increased sales at existing, established locations.
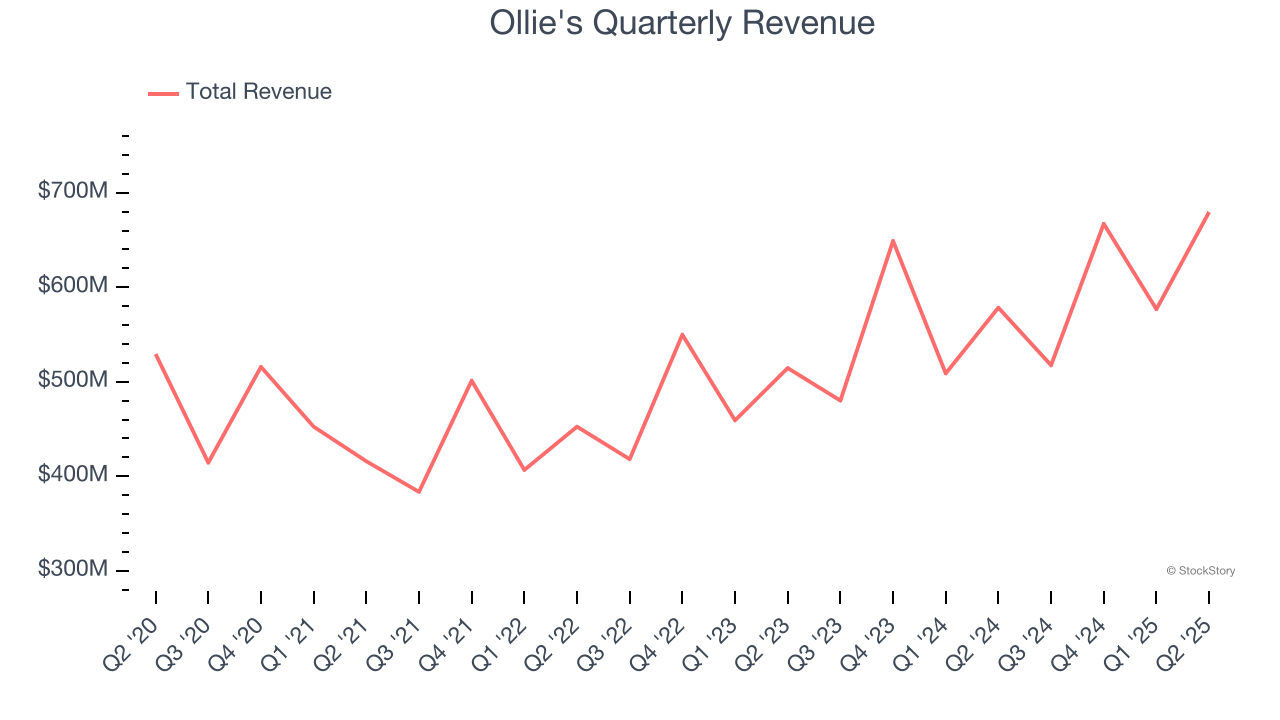
This quarter, Ollie's reported year-on-year revenue growth of 17.5%, and its $679.6 million of revenue exceeded Wall Street’s estimates by 2.7%.
Looking ahead, sell-side analysts expect revenue to grow 12.9% over the next 12 months, an acceleration versus the last six years. This projection is eye-popping and implies its newer products will spur better top-line performance.
Here at StockStory, we certainly understand the potential of thematic investing. Diverse winners from Microsoft (MSFT) to Alphabet (GOOG), Coca-Cola (KO) to Monster Beverage (MNST) could all have been identified as promising growth stories with a megatrend driving the growth. So, in that spirit, we’ve identified a relatively under-the-radar profitable growth stock benefiting from the rise of AI, available to you FREE via this link.
Store Performance
Number of Stores
The number of stores a retailer operates is a critical driver of how quickly company-level sales can grow.
Ollie's sported 613 locations in the latest quarter. Over the last two years, it has opened new stores at a rapid clip by averaging 10.4% annual growth, among the fastest in the consumer retail sector. This gives it a chance to scale into a mid-sized business over time.
When a retailer opens new stores, it usually means it’s investing for growth because demand is greater than supply, especially in areas where consumers may not have a store within reasonable driving distance.
Same-Store Sales
The change in a company's store base only tells one side of the story. The other is the performance of its existing locations and e-commerce sales, which informs management teams whether they should expand or downsize their physical footprints. Same-store sales provides a deeper understanding of this issue because it measures organic growth at brick-and-mortar shops for at least a year.
Ollie’s demand has been spectacular for a retailer over the last two years. On average, the company has increased its same-store sales by an impressive 3.7% per year. This performance along with its meaningful buildout of new stores suggest it’s playing some aggressive offense.
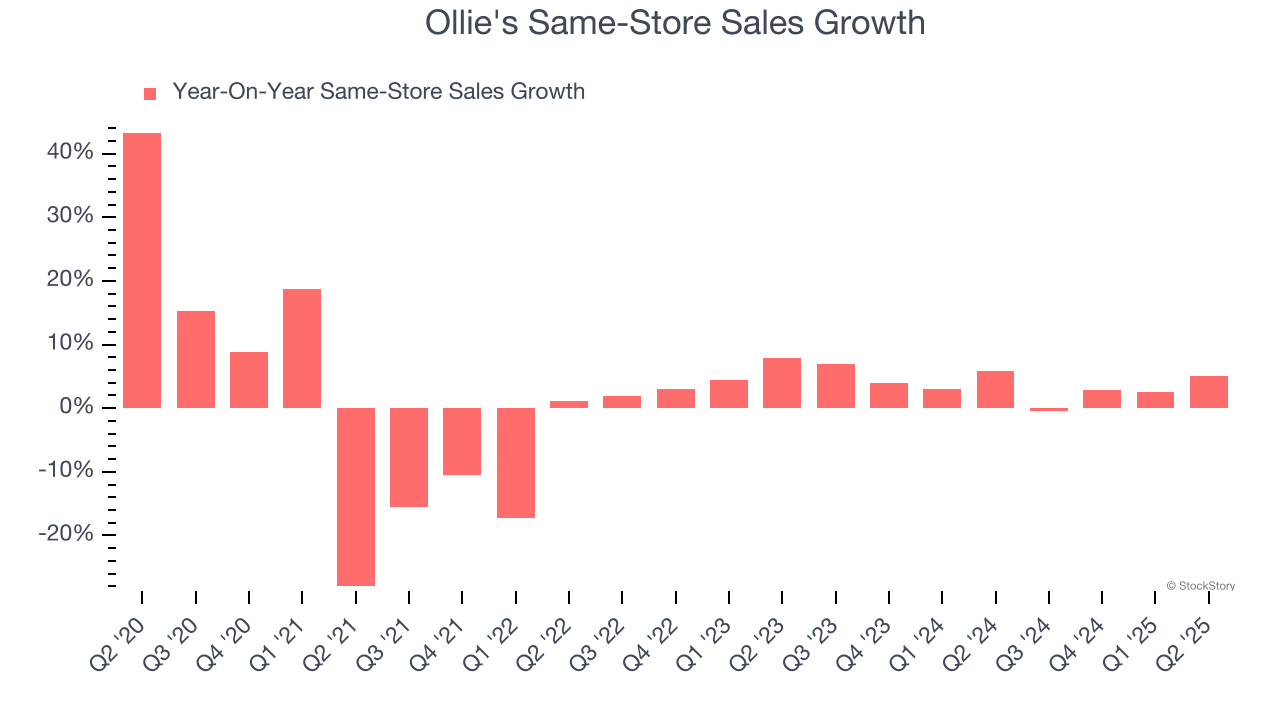
In the latest quarter, Ollie’s same-store sales rose 5% year on year. This growth was an acceleration from its historical levels, which is always an encouraging sign.
Key Takeaways from Ollie’s Q2 Results
We enjoyed seeing Ollie's beat analysts’ EBITDA expectations this quarter. We were also glad its revenue outperformed Wall Street’s estimates. Overall, we think this was a decent quarter with some key metrics above expectations. The stock traded up 5.3% to $137.63 immediately after reporting.
Sure, Ollie's had a solid quarter, but if we look at the bigger picture, is this stock a buy? If you’re making that decision, you should consider the bigger picture of valuation, business qualities, as well as the latest earnings. We cover that in our actionable full research report which you can read here, it’s free.


