
Government engineering solutions provider Amentum Holdings (NYSE: AMTM) announced better-than-expected revenue in Q2 CY2025, with sales up 2% year on year to $3.56 billion. The company expects the full year’s revenue to be around $14.08 billion, close to analysts’ estimates. Its GAAP profit of $0.04 per share was 73.3% below analysts’ consensus estimates.
Is now the time to buy Amentum? Find out by accessing our full research report, it’s free.
Amentum (AMTM) Q2 CY2025 Highlights:
- Revenue: $3.56 billion vs analyst estimates of $3.51 billion (2% year-on-year growth, 1.5% beat)
- EPS (GAAP): $0.04 vs analyst expectations of $0.15 (73.3% miss)
- Adjusted EBITDA: $274 million vs analyst estimates of $268.6 million (7.7% margin, 2% beat)
- The company slightly lifted its revenue guidance for the full year to $14.08 billion at the midpoint from $14 billion
- EBITDA guidance for the full year is $1.08 billion at the midpoint, in line with analyst expectations
- Operating Margin: 2.9%, in line with the same quarter last year
- Free Cash Flow Margin: 2.8%, similar to the same quarter last year
- Backlog: $44.6 billion at quarter end
- Market Capitalization: $5.96 billion
“Amentum’s third quarter performance reflects strong execution and demonstrates the continued strength of our business,” said Amentum Chief Executive Officer John Heller.
Company Overview
With operations spanning approximately 80 countries and a workforce of specialized engineers and technical experts, Amentum Holdings (NYSE: AMTM) provides advanced engineering and technology solutions to U.S. government agencies, allied governments, and commercial enterprises across defense, energy, and space sectors.
Revenue Growth
A company’s top-line performance can indicate its business quality. Rapid growth can signal it’s benefiting from an innovative new product or burgeoning market trend.
With $14.03 billion in revenue over the past 12 months, Amentum is larger than most business services companies and benefits from economies of scale, enabling it to gain more leverage on its fixed costs than smaller competitors. This also gives it the flexibility to offer lower prices.
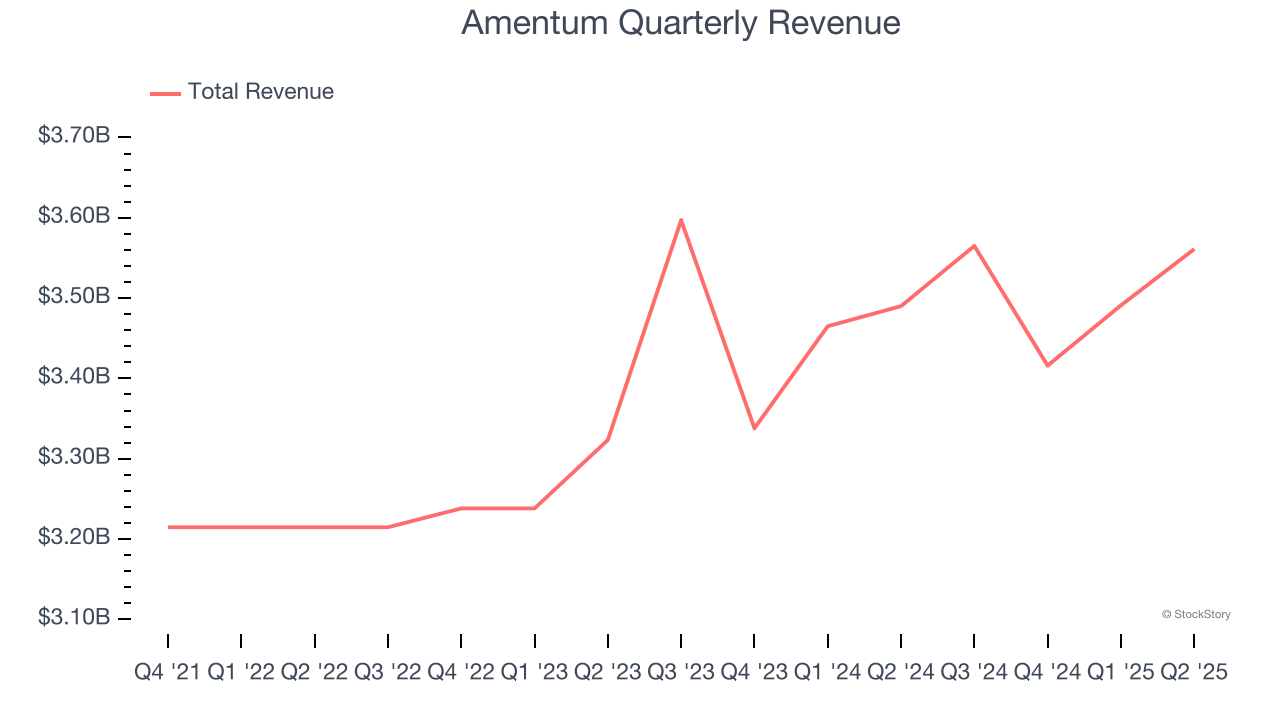
This quarter, Amentum reported modest year-on-year revenue growth of 2% but beat Wall Street’s estimates by 1.5%.
Looking ahead, sell-side analysts expect revenue to grow 1.6% over the next 12 months, a slight deceleration versus the last two years. This projection doesn't excite us and implies its products and services will see some demand headwinds.
Here at StockStory, we certainly understand the potential of thematic investing. Diverse winners from Microsoft (MSFT) to Alphabet (GOOG), Coca-Cola (KO) to Monster Beverage (MNST) could all have been identified as promising growth stories with a megatrend driving the growth. So, in that spirit, we’ve identified a relatively under-the-radar profitable growth stock benefiting from the rise of AI, available to you FREE via this link.
Operating Margin
Operating margin is a key measure of profitability. Think of it as net income - the bottom line - excluding the impact of taxes and interest on debt, which are less connected to business fundamentals.
Amentum’s operating margin might fluctuated slightly over the last 12 months but has remained more or less the same, averaging 2.1% over the last three years. This profitability was lousy for a business services business and caused by its suboptimal cost structure.
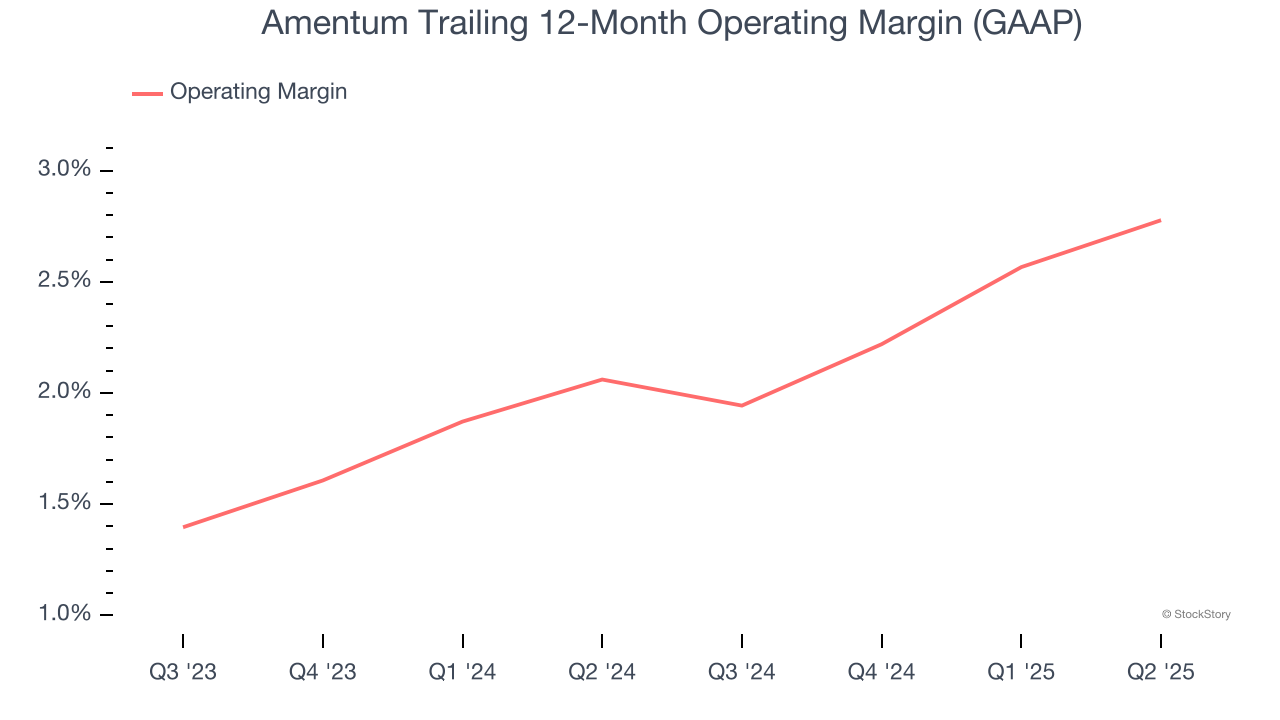
In Q2, Amentum generated an operating margin profit margin of 2.9%, in line with the same quarter last year. This indicates the company’s overall cost structure has been relatively stable.
Cash Is King
Free cash flow isn't a prominently featured metric in company financials and earnings releases, but we think it's telling because it accounts for all operating and capital expenses, making it tough to manipulate. Cash is king.
Amentum has shown poor cash profitability over the last four years, giving the company limited opportunities to return capital to shareholders. Its free cash flow margin averaged 1.7%, lousy for a business services business.
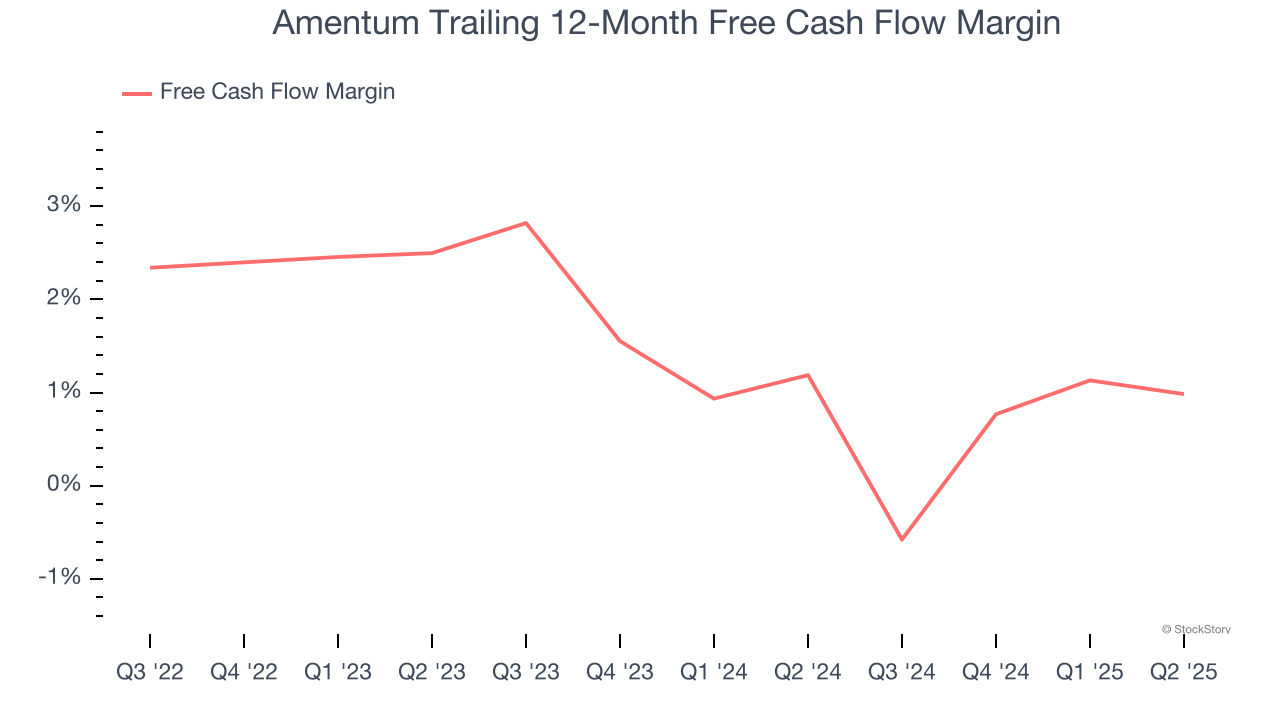
Amentum’s free cash flow clocked in at $100 million in Q2, equivalent to a 2.8% margin. This cash profitability was in line with the comparable period last year and above its four-year average.
Key Takeaways from Amentum’s Q2 Results
It was good to see Amentum narrowly top analysts’ revenue expectations this quarter. On the other hand, its EPS missed. Overall, this was a mixed quarter. The stock traded down 2.5% to $24.68 immediately after reporting.
Amentum underperformed this quarter, but does that create an opportunity to invest right now? If you’re making that decision, you should consider the bigger picture of valuation, business qualities, as well as the latest earnings. We cover that in our actionable full research report which you can read here, it’s free.