
Life sciences company Azenta (NASDAQ: AZTA) fell short of the market’s revenue expectations in Q2 CY2025, with sales flat year on year at $143.9 million. Its non-GAAP profit of $0.14 per share was in line with analysts’ consensus estimates.
Is now the time to buy Azenta? Find out by accessing our full research report, it’s free.
Azenta (AZTA) Q2 CY2025 Highlights:
- Revenue: $143.9 million vs analyst estimates of $149.6 million (flat year on year, 3.8% miss)
- Adjusted EPS: $0.14 vs analyst estimates of $0.14 (in line)
- Adjusted EBITDA: $18 million vs analyst estimates of $17.29 million (12.5% margin, 4.1% beat)
- Operating Margin: -0.5%, up from -4.9% in the same quarter last year
- Free Cash Flow was $14.97 million, up from -$2.18 million in the same quarter last year
- Market Capitalization: $1.48 billion
"We've made significant changes across the organization and our operational turnaround is progressing as planned. Despite a challenging macro environment, we drove meaningful margin expansion through disciplined cost management and focused execution," said John Marotta, President and CEO.
Company Overview
Serving as the guardian of some of medicine's most valuable materials, Azenta (NASDAQ: AZTA) provides biological sample management, storage, and genomic services that help pharmaceutical and biotechnology companies preserve and analyze critical research materials.
Revenue Growth
A company’s long-term sales performance can indicate its overall quality. Any business can put up a good quarter or two, but many enduring ones grow for years. Over the last five years, Azenta’s demand was weak and its revenue declined by 7.2% per year. This wasn’t a great result and suggests it’s a low quality business.
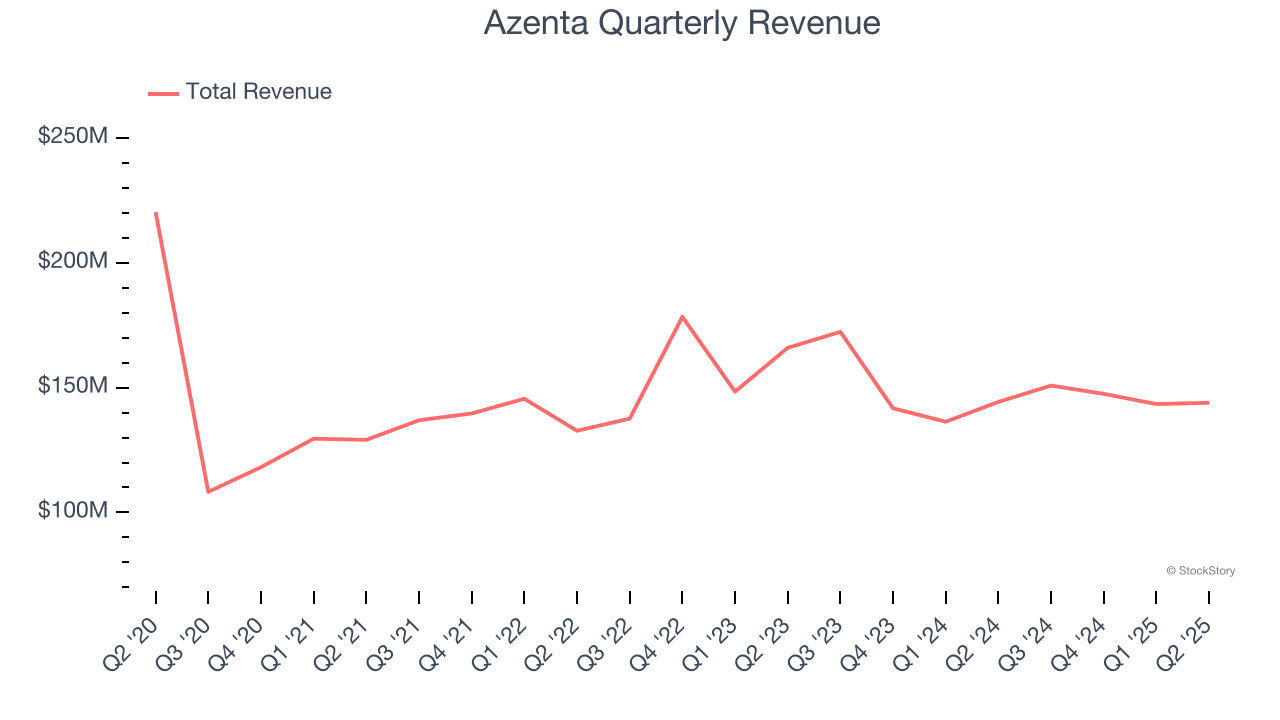
Long-term growth is the most important, but within healthcare, a half-decade historical view may miss new innovations or demand cycles. Azenta’s annualized revenue declines of 3.6% over the last two years suggest its demand continued shrinking. 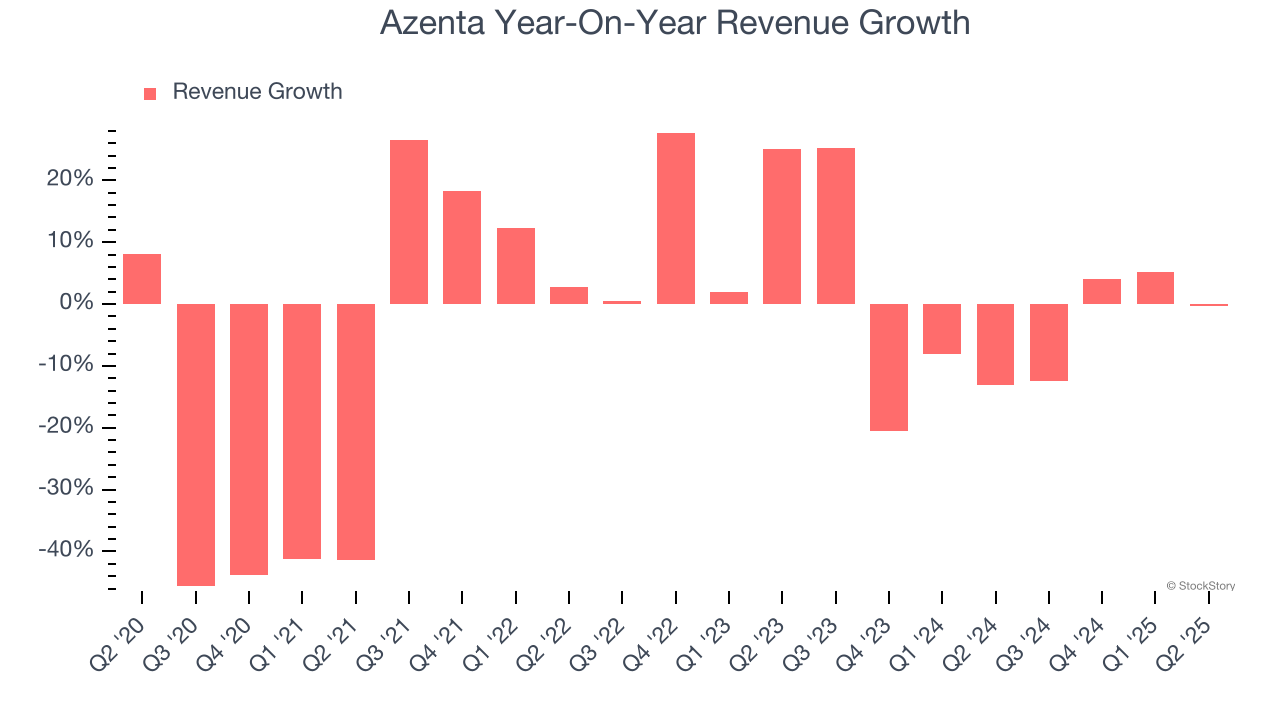
We can dig further into the company’s revenue dynamics by analyzing its most important segment, Sample Management. Over the last two years, Azenta’s Sample Management revenue averaged 4.5% year-on-year growth. This segment has outperformed its total sales during the same period, lifting the company’s performance. 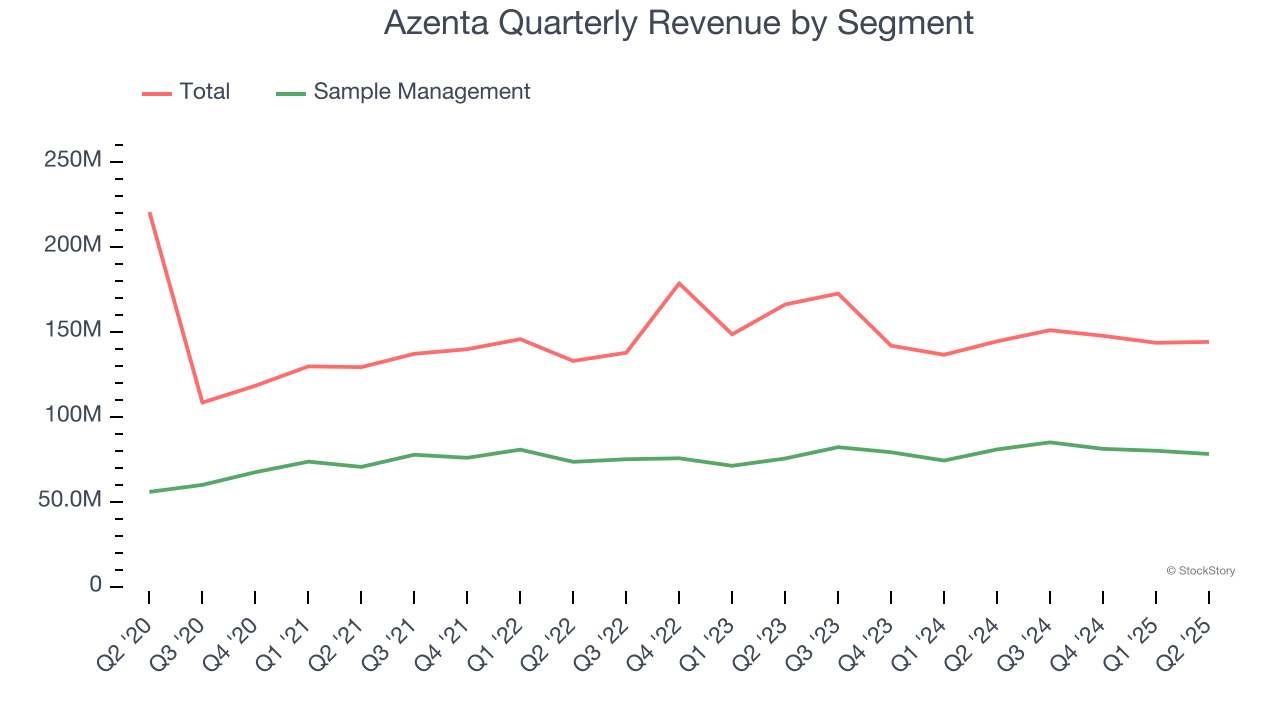
This quarter, Azenta missed Wall Street’s estimates and reported a rather uninspiring 0.2% year-on-year revenue decline, generating $143.9 million of revenue.
Looking ahead, sell-side analysts expect revenue to grow 5.8% over the next 12 months, an improvement versus the last two years. This projection is above average for the sector and indicates its newer products and services will fuel better top-line performance.
Here at StockStory, we certainly understand the potential of thematic investing. Diverse winners from Microsoft (MSFT) to Alphabet (GOOG), Coca-Cola (KO) to Monster Beverage (MNST) could all have been identified as promising growth stories with a megatrend driving the growth. So, in that spirit, we’ve identified a relatively under-the-radar profitable growth stock benefiting from the rise of AI, available to you FREE via this link.
Operating Margin
Operating margin is an important measure of profitability as it shows the portion of revenue left after accounting for all core expenses – everything from the cost of goods sold to advertising and wages. It’s also useful for comparing profitability across companies with different levels of debt and tax rates because it excludes interest and taxes.
Although Azenta broke even this quarter from an operational perspective, it’s generally struggled over a longer time period. Its expensive cost structure has contributed to an average operating margin of negative 7.3% over the last five years. Unprofitable healthcare companies require extra attention because they could get caught swimming naked when the tide goes out. It’s hard to trust that the business can endure a full cycle.
Looking at the trend in its profitability, Azenta’s operating margin decreased by 3 percentage points over the last five years, but it rose by 6 percentage points on a two-year basis. Still, shareholders will want to see Azenta become more profitable in the future.
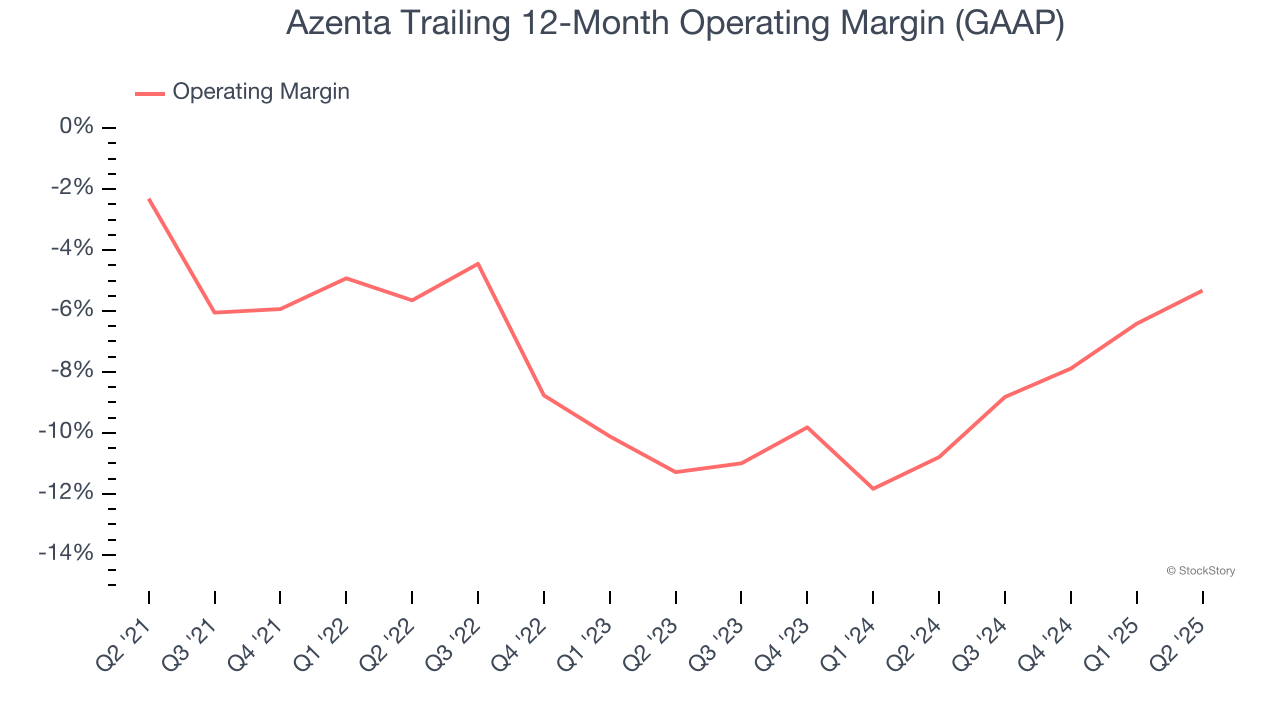
Azenta’s operating margin was negative 0.5% this quarter. The company's consistent lack of profits raise a flag.
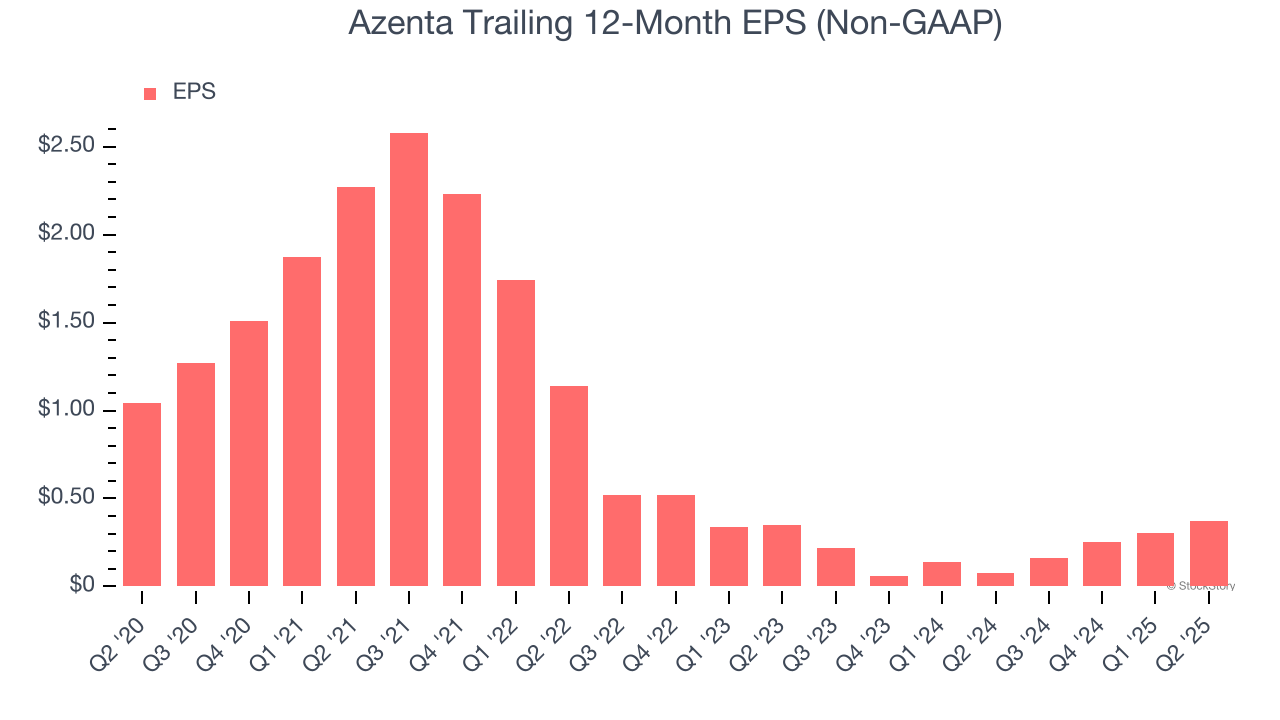
Earnings Per Share
Revenue trends explain a company’s historical growth, but the long-term change in earnings per share (EPS) points to the profitability of that growth – for example, a company could inflate its sales through excessive spending on advertising and promotions.
Sadly for Azenta, its EPS declined by 18.7% annually over the last five years, more than its revenue. This tells us the company struggled because its fixed cost base made it difficult to adjust to shrinking demand.
We can take a deeper look into Azenta’s earnings to better understand the drivers of its performance. As we mentioned earlier, Azenta’s operating margin expanded this quarter but declined by 3 percentage points over the last five years. This was the most relevant factor (aside from the revenue impact) behind its lower earnings; interest expenses and taxes can also affect EPS but don’t tell us as much about a company’s fundamentals.
In Q2, Azenta reported adjusted EPS at $0.14, up from $0.07 in the same quarter last year. This print beat analysts’ estimates by 1%. Over the next 12 months, Wall Street expects Azenta’s full-year EPS of $0.37 to grow 105%.
Key Takeaways from Azenta’s Q2 Results
While revenue missed, EPS was in line. Overall, this quarter could have been better. Still, the stock traded up 2% to $33.06 immediately after reporting.
Is Azenta an attractive investment opportunity right now? What happened in the latest quarter matters, but not as much as longer-term business quality and valuation, when deciding whether to invest in this stock. We cover that in our actionable full research report which you can read here, it’s free.