
Insurance holding company Kemper (NYSE: KMPR) missed Wall Street’s revenue expectations in Q2 CY2025, but sales rose 8.4% year on year to $1.23 billion. Its non-GAAP profit of $1.30 per share was 13.8% below analysts’ consensus estimates.
Is now the time to buy Kemper? Find out by accessing our full research report, it’s free.
Kemper (KMPR) Q2 CY2025 Highlights:
- Net Premiums Earned: $1.13 billion vs analyst estimates of $1.11 billion (9.4% year-on-year growth, 1.9% beat)
- Revenue: $1.23 billion vs analyst estimates of $1.24 billion (8.4% year-on-year growth, 0.8% miss)
- Combined Ratio: 93.6% vs analyst estimates of 93.7% (in line)
- Adjusted EPS: $1.30 vs analyst expectations of $1.51 (13.8% miss)
- Market Capitalization: $3.90 billion
“We’re pleased that we delivered another quarter of strong operating performance,” said President and CEO Joseph P. Lacher, Jr.
Company Overview
Originally known as Unitrin until rebranding in 2011, Kemper (NYSE: KMPR) is an insurance holding company that provides automobile, homeowners, life, and other insurance products to individuals and businesses across the United States.
Revenue Growth
Insurers earn revenue three ways. The core insurance business itself, often called underwriting and represented in the income statement as premiums earned, is one way. Investment income from investing the “float” (premiums collected upfront not yet paid out as claims) in assets such as fixed-income assets and equities is the second way. Fees from various sources such as policy administration, annuities, or other value-added services is the third.
Unfortunately, Kemper struggled to consistently increase demand as its $4.79 billion of revenue for the trailing 12 months was close to its revenue five years ago. This wasn’t a great result and suggests it’s a low quality business.
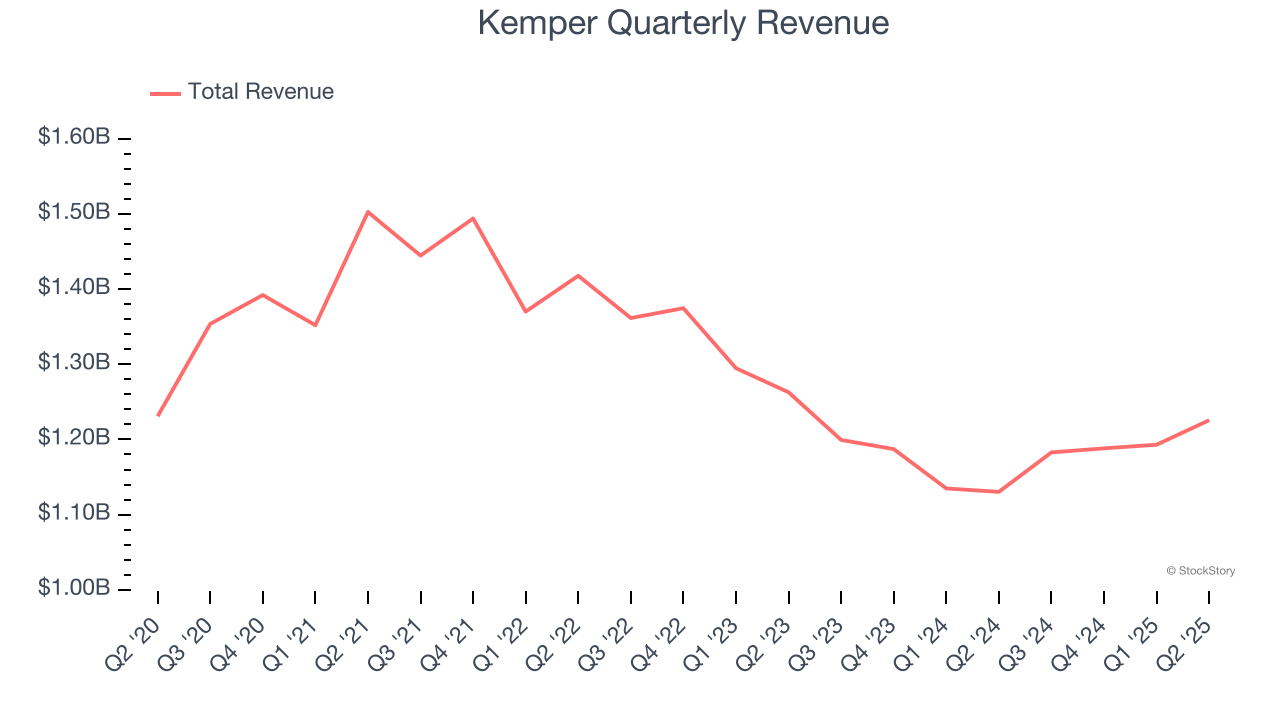
We at StockStory place the most emphasis on long-term growth, but within financials, a half-decade historical view may miss recent interest rate changes, market returns, and industry trends. Kemper’s recent performance shows its demand remained suppressed as its revenue has declined by 4.9% annually over the last two years. 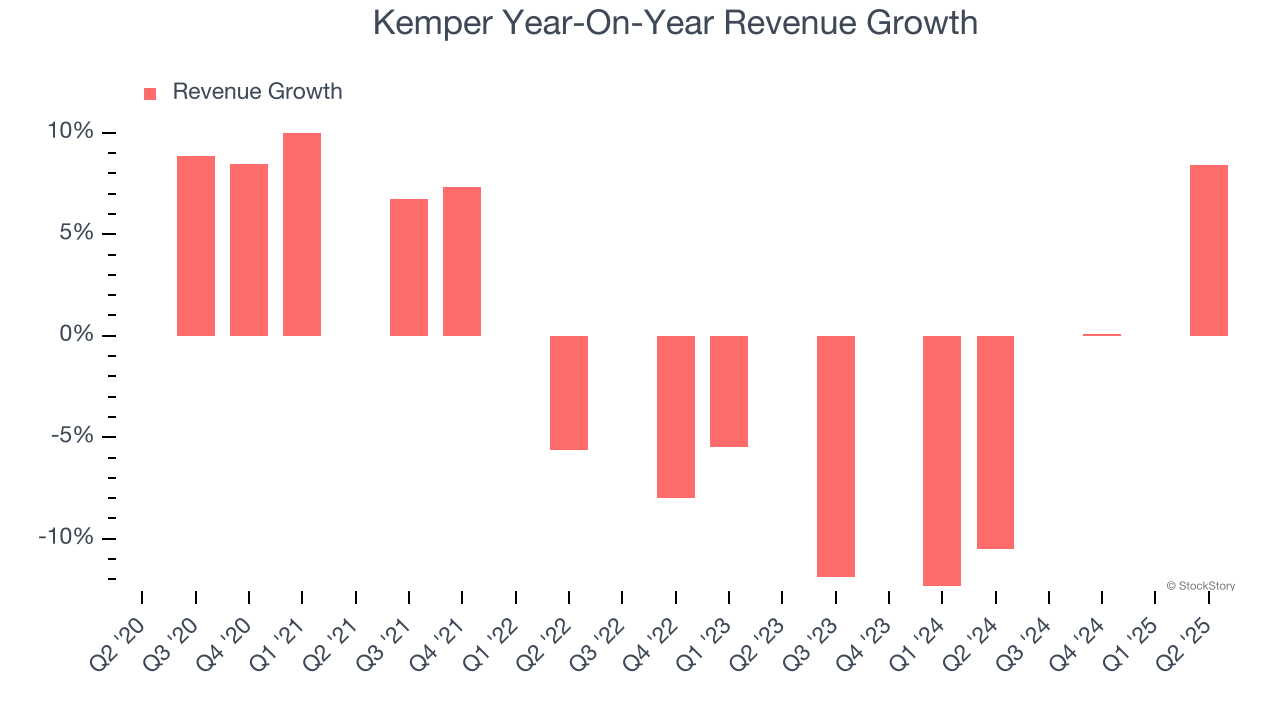 Note: Quarters not shown were determined to be outliers, impacted by outsized investment gains/losses that are not indicative of the recurring fundamentals of the business.
This quarter, Kemper’s revenue grew by 8.4% year on year to $1.23 billion, missing Wall Street’s estimates.
Net premiums earned made up 91.5% of the company’s total revenue during the last five years, meaning Kemper lives and dies by its underwriting activities because non-insurance operations barely move the needle.
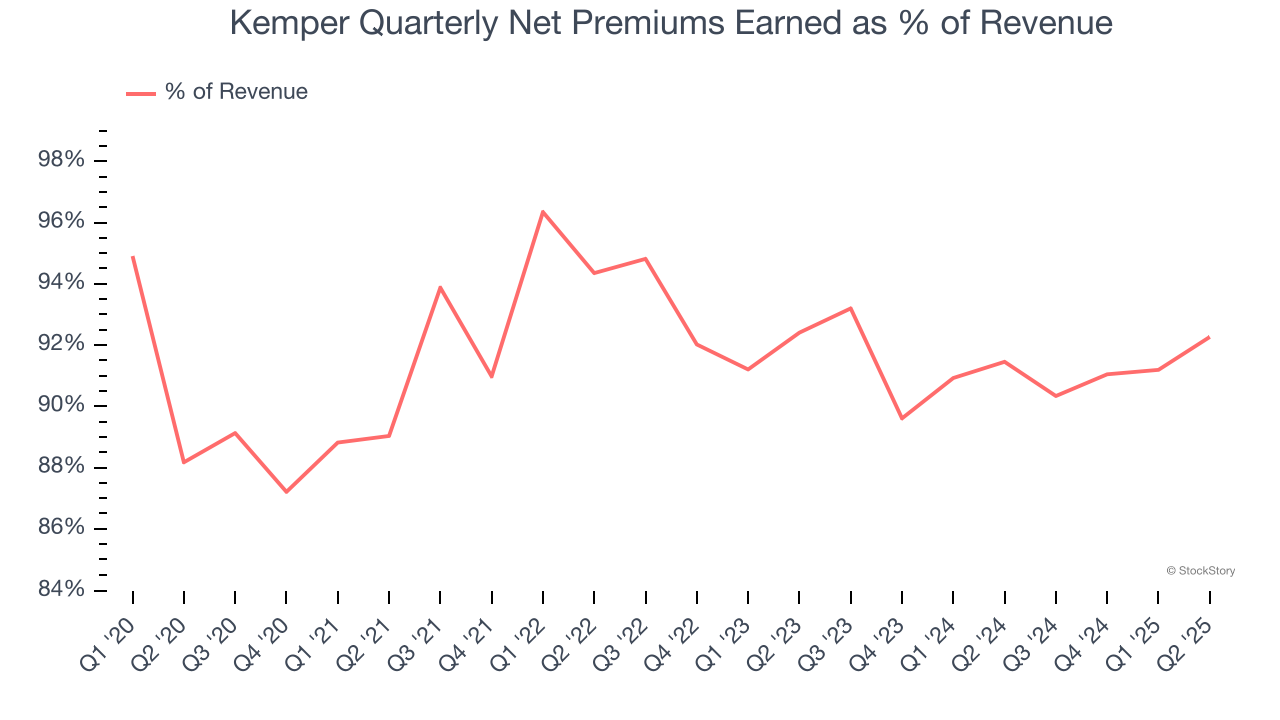
While insurers generate revenue from multiple sources, investors view net premiums earned as the cornerstone - its direct link to core operations stands in sharp contrast to the unpredictability of investment returns and fees.
Software is eating the world and there is virtually no industry left that has been untouched by it. That drives increasing demand for tools helping software developers do their jobs, whether it be monitoring critical cloud infrastructure, integrating audio and video functionality, or ensuring smooth content streaming. Click here to access a free report on our 3 favorite stocks to play this generational megatrend.
Book Value Per Share (BVPS)
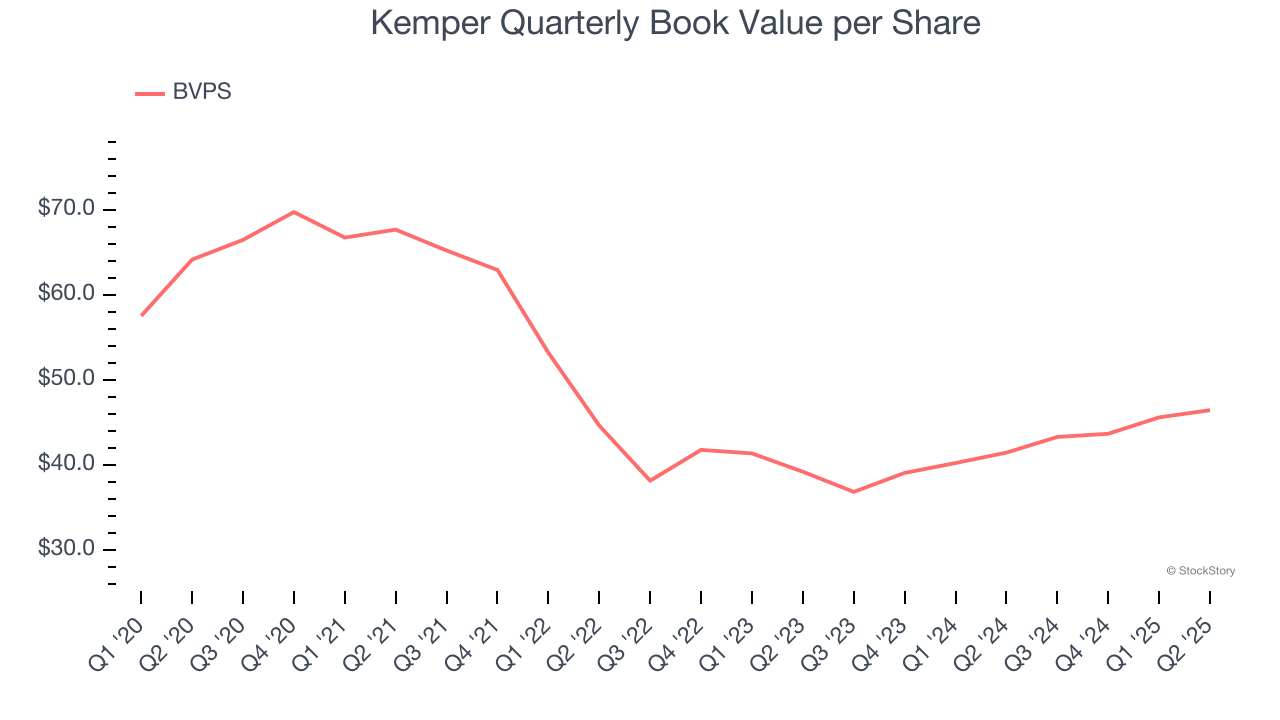
Insurance companies are balance sheet businesses, collecting premiums upfront and paying out claims over time. The float–premiums collected but not yet paid out–are invested, creating an asset base supported by a liability structure. Book value per share (BVPS) captures this dynamic by measuring these assets (investment portfolio, cash, reinsurance recoverables) less liabilities (claim reserves, debt, future policy benefits). BVPS is essentially the residual value for shareholders.
We therefore consider BVPS very important to track for insurers and a metric that sheds light on business quality because it reflects long-term capital growth and is harder to manipulate than more commonly-used metrics like EPS.
Kemper’s BVPS declined at a 6.3% annual clip over the last five years. However, BVPS growth has accelerated recently, growing by 8.8% annually over the last two years from $39.22 to $46.45 per share.
Key Takeaways from Kemper’s Q2 Results
We enjoyed seeing Kemper beat analysts’ net premiums earned expectations this quarter. On the other hand, its EPS missed and its book value per share fell short of Wall Street’s estimates. Overall, this quarter could have been better. The stock traded down 4.1% to $59 immediately following the results.
Kemper’s latest earnings report disappointed. One quarter doesn’t define a company’s quality, so let’s explore whether the stock is a buy at the current price. If you’re making that decision, you should consider the bigger picture of valuation, business qualities, as well as the latest earnings. We cover that in our actionable full research report which you can read here, it’s free.