
Residential swimming pool manufacturer Latham (NASDAQ: SWIM) fell short of the market’s revenue expectations in Q2 CY2025, but sales rose 7.8% year on year to $172.6 million. On the other hand, the company’s full-year revenue guidance of $550 million at the midpoint came in 1.1% above analysts’ estimates. Its GAAP profit of $0.13 per share was in line with analysts’ consensus estimates.
Is now the time to buy Latham? Find out by accessing our full research report, it’s free.
Latham (SWIM) Q2 CY2025 Highlights:
- Revenue: $172.6 million vs analyst estimates of $175.2 million (7.8% year-on-year growth, 1.4% miss)
- EPS (GAAP): $0.13 vs analyst estimates of $0.12 (in line)
- Adjusted EBITDA: $39.89 million vs analyst estimates of $38.96 million (23.1% margin, 2.4% beat)
- The company reconfirmed its revenue guidance for the full year of $550 million at the midpoint
- EBITDA guidance for the full year is $95 million at the midpoint, above analyst estimates of $92.64 million
- Operating Margin: 14.3%, up from 12.5% in the same quarter last year
- Free Cash Flow Margin: 16.8%, down from 29.9% in the same quarter last year
- Market Capitalization: $784.3 million
Commenting on the results, Scott Rajeski, President and CEO, said, “Our second quarter performance demonstrated the continued execution of our strategy to drive awareness and adoption of fiberglass pools and autocovers, expand our presence in the Sand State markets, and improve margins through lean manufacturing and value engineering initiatives and accretive acquisitions.
Company Overview
Started as a family business, Latham (NASDAQ: SWIM) is a global designer and manufacturer of in-ground residential swimming pools and related products.
Revenue Growth
A company’s long-term sales performance is one signal of its overall quality. Any business can have short-term success, but a top-tier one grows for years. Over the last five years, Latham grew its sales at a 11.6% annual rate. Although this growth is acceptable on an absolute basis, it fell short of our standards for the consumer discretionary sector, which enjoys a number of secular tailwinds.
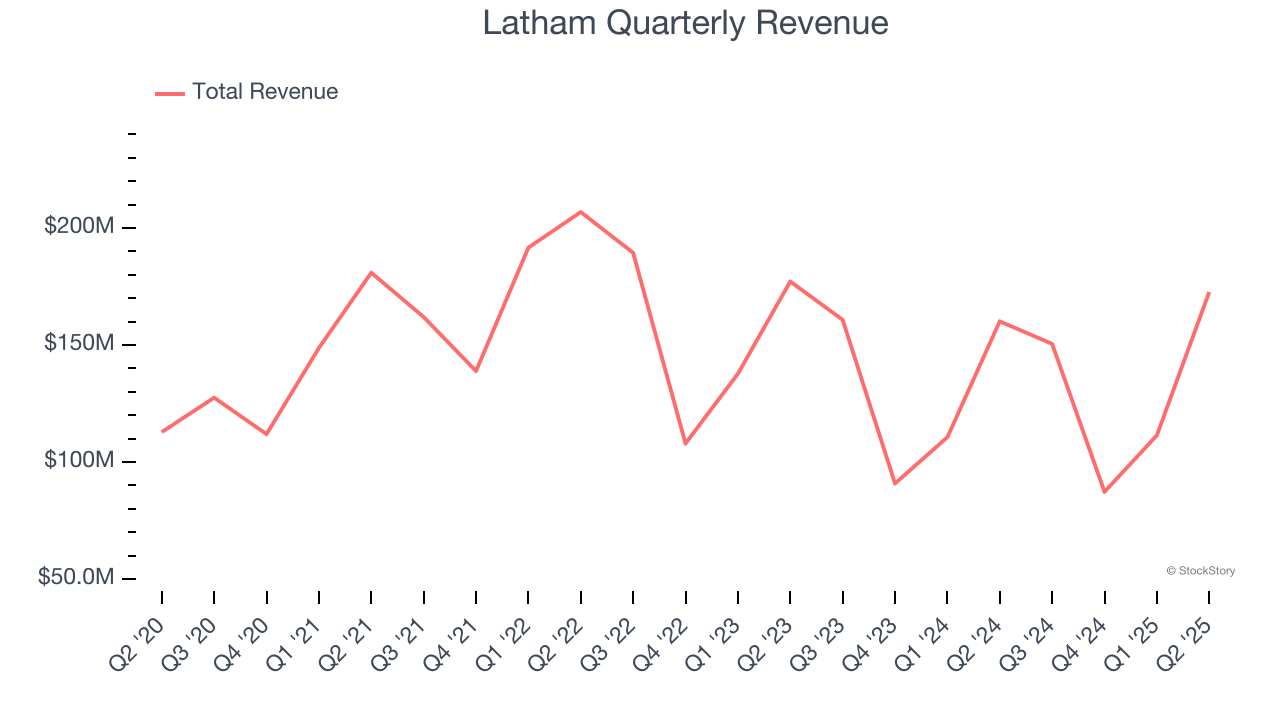
Long-term growth is the most important, but within consumer discretionary, product cycles are short and revenue can be hit-driven due to rapidly changing trends and consumer preferences. Latham’s performance shows it grew in the past but relinquished its gains over the last two years, as its revenue fell by 7.7% annually. 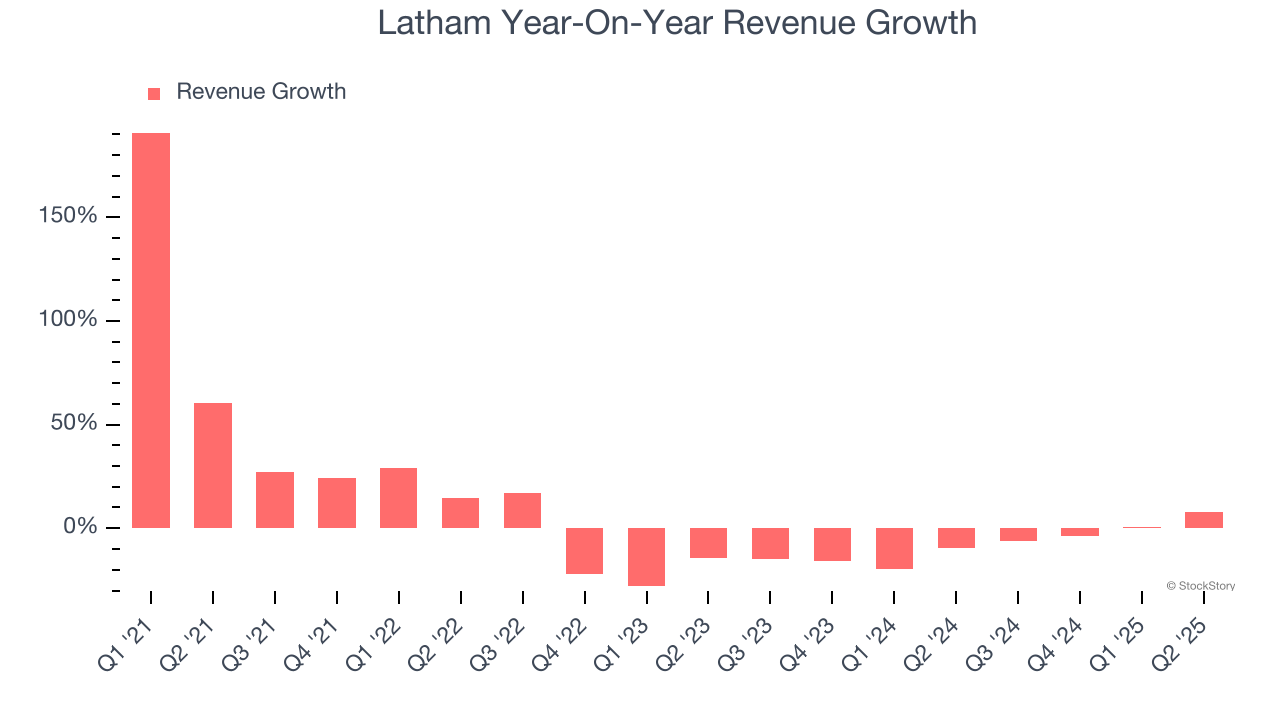
This quarter, Latham’s revenue grew by 7.8% year on year to $172.6 million, missing Wall Street’s estimates.
Looking ahead, sell-side analysts expect revenue to grow 7.2% over the next 12 months. Although this projection implies its newer products and services will fuel better top-line performance, it is still below average for the sector.
Today’s young investors won’t have read the timeless lessons in Gorilla Game: Picking Winners In High Technology because it was written more than 20 years ago when Microsoft and Apple were first establishing their supremacy. But if we apply the same principles, then enterprise software stocks leveraging their own generative AI capabilities may well be the Gorillas of the future. So, in that spirit, we are excited to present our Special Free Report on a profitable, fast-growing enterprise software stock that is already riding the automation wave and looking to catch the generative AI next.
Operating Margin
Latham’s operating margin has been trending down over the last 12 months and averaged 4.5% over the last two years. The company’s profitability was mediocre for a consumer discretionary business and shows it couldn’t pass its higher operating expenses onto its customers.
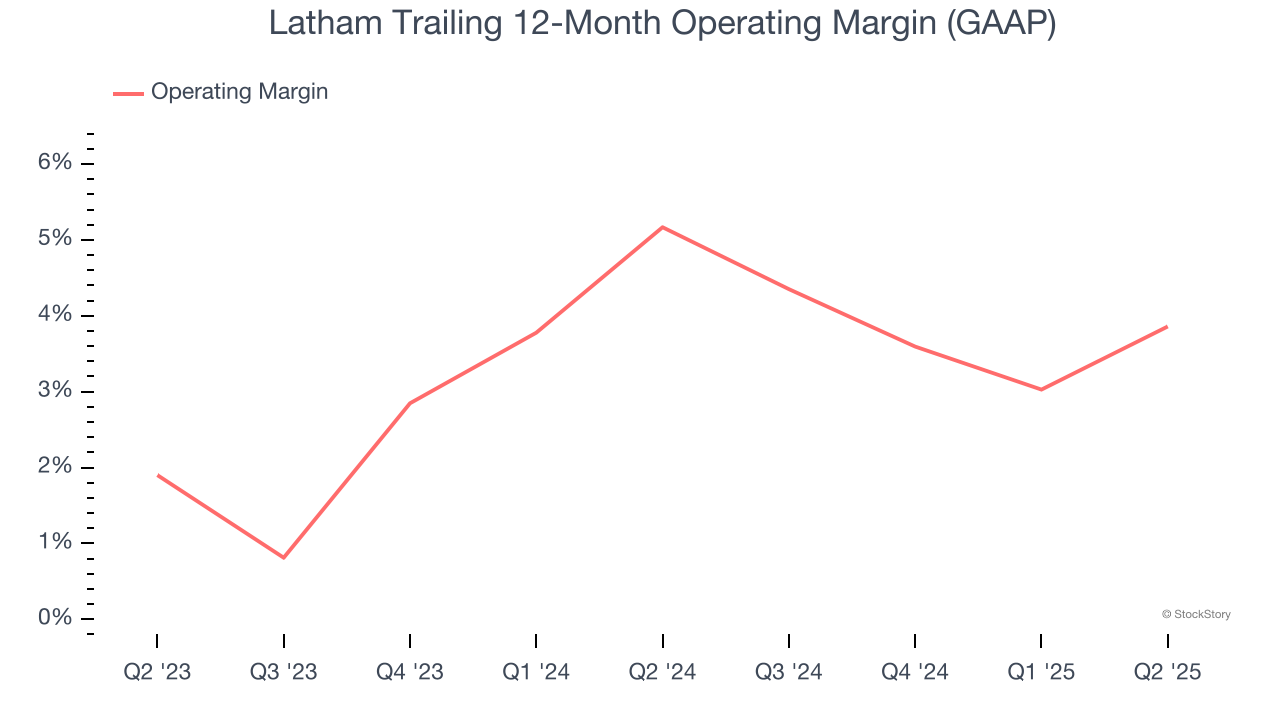
In Q2, Latham generated an operating margin profit margin of 14.3%, up 1.8 percentage points year on year. This increase was a welcome development and shows it was more efficient.
Earnings Per Share
We track the long-term change in earnings per share (EPS) for the same reason as long-term revenue growth. Compared to revenue, however, EPS highlights whether a company’s growth is profitable.
Latham’s EPS grew at a spectacular 22.6% compounded annual growth rate over the last five years, higher than its 11.6% annualized revenue growth. However, we take this with a grain of salt because its operating margin didn’t improve and it didn’t repurchase its shares, meaning the delta came from reduced interest expenses or taxes.
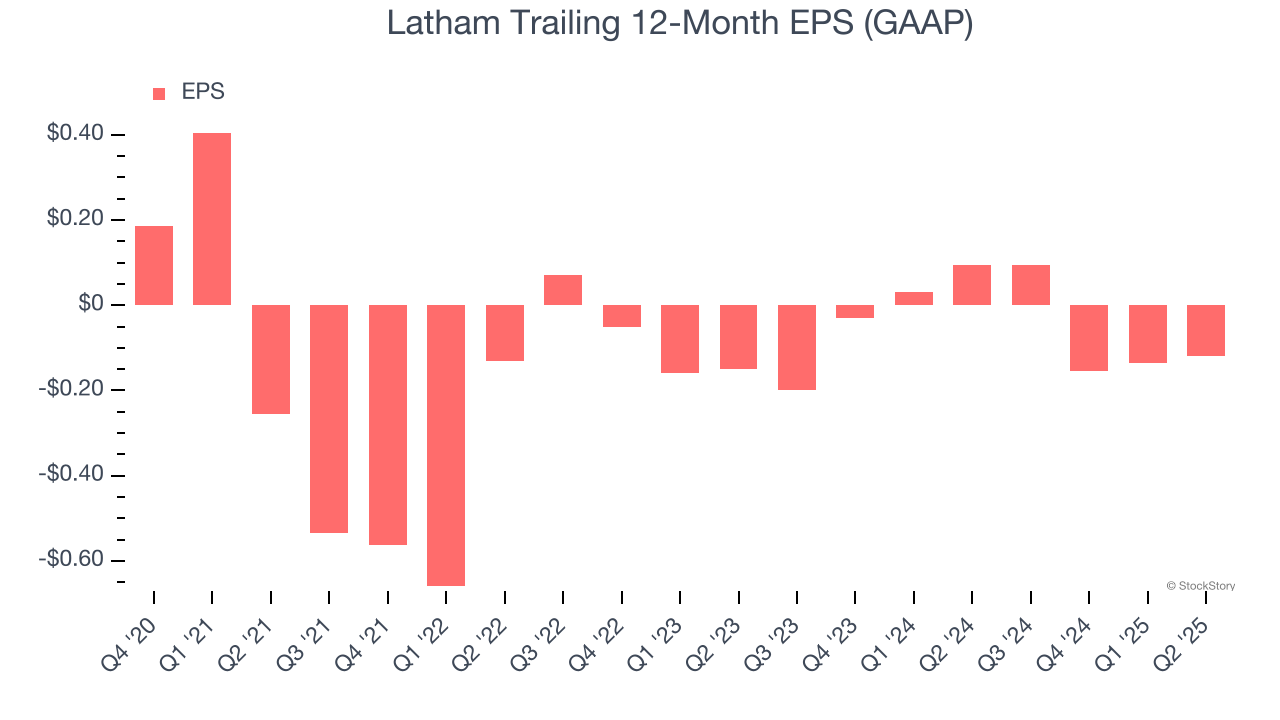
In Q2, Latham reported EPS at $0.13, up from $0.11 in the same quarter last year. This print beat analysts’ estimates by 7.7%. Over the next 12 months, Wall Street is optimistic. Analysts forecast Latham’s full-year EPS of negative $0.12 will reach break even.
Key Takeaways from Latham’s Q2 Results
It was good to see Latham provide full-year revenue guidance that slightly beat analysts’ expectations. We were also happy its EPS outperformed Wall Street’s estimates. On the other hand, its revenue slightly missed. Overall, this print had some key positives. Investors were likely hoping for more, and shares traded down 3.2% to $6.62 immediately following the results.
So do we think Latham is an attractive buy at the current price? When making that decision, it’s important to consider its valuation, business qualities, as well as what has happened in the latest quarter. We cover that in our actionable full research report which you can read here, it’s free.


