Beauty supply retailer Sally Beauty (NYSE: SBH) met Wall Street’s revenue expectations in Q2 CY2025, but sales were flat year on year at $933.3 million. Its non-GAAP profit of $0.51 per share was 21.4% above analysts’ consensus estimates.
Is now the time to buy Sally Beauty? Find out by accessing our full research report, it’s free.
Sally Beauty (SBH) Q2 CY2025 Highlights:
- Revenue: $933.3 million vs analyst estimates of $932.7 million (flat year on year, in line)
- Adjusted EPS: $0.51 vs analyst estimates of $0.42 (21.4% beat)
- Adjusted EBITDA: $115.3 million vs analyst estimates of $103.8 million (12.4% margin, 11.1% beat)
- Operating Margin: 8.4%, in line with the same quarter last year
- Free Cash Flow Margin: 5.3%, up from 3.1% in the same quarter last year
- Locations: 35 at quarter end, down from 4,460 in the same quarter last year
- Same-Store Sales were flat year on year (1.5% in the same quarter last year)
- Market Capitalization: $1.01 billion
“Our third quarter results, including improved topline trends and solid year-over-year growth in operating profit, showcase the resilience of our business and the customer service focus of our team,” said Denise Paulonis, president and chief executive officer.
Company Overview
Catering to both everyday consumers as well as salon professionals, Sally Beauty (NYSE: SBH) is a retailer that sells salon-quality beauty products such as makeup and haircare products.
Revenue Growth
Examining a company’s long-term performance can provide clues about its quality. Any business can have short-term success, but a top-tier one grows for years.
With $3.69 billion in revenue over the past 12 months, Sally Beauty is a small retailer, which sometimes brings disadvantages compared to larger competitors benefiting from economies of scale and negotiating leverage with suppliers.
As you can see below, Sally Beauty struggled to increase demand as its $3.69 billion of sales for the trailing 12 months was close to its revenue six years ago (we compare to 2019 to normalize for COVID-19 impacts). This was mainly because it closed stores.
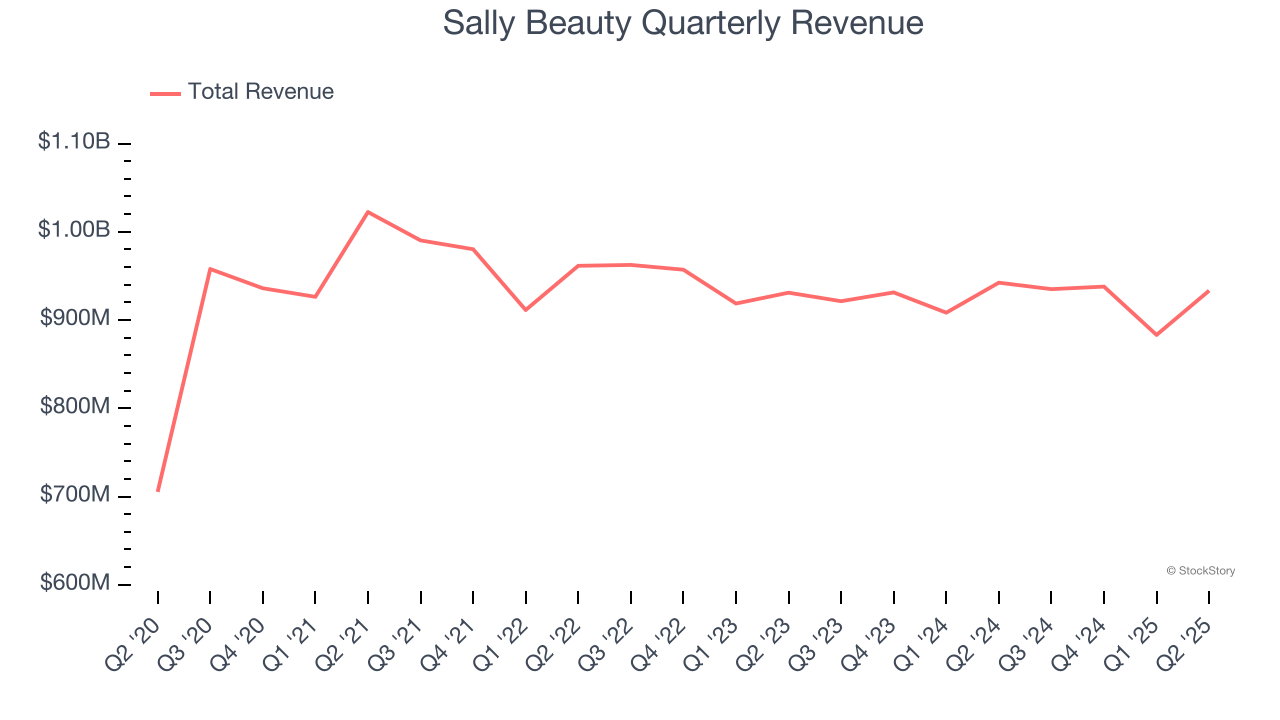
This quarter, Sally Beauty’s $933.3 million of revenue was flat year on year and in line with Wall Street’s estimates.
Looking ahead, sell-side analysts expect revenue to remain flat over the next 12 months. Although this projection implies its newer products will fuel better top-line performance, it is still below average for the sector.
Today’s young investors won’t have read the timeless lessons in Gorilla Game: Picking Winners In High Technology because it was written more than 20 years ago when Microsoft and Apple were first establishing their supremacy. But if we apply the same principles, then enterprise software stocks leveraging their own generative AI capabilities may well be the Gorillas of the future. So, in that spirit, we are excited to present our Special Free Report on a profitable, fast-growing enterprise software stock that is already riding the automation wave and looking to catch the generative AI next.
Store Performance
Number of Stores
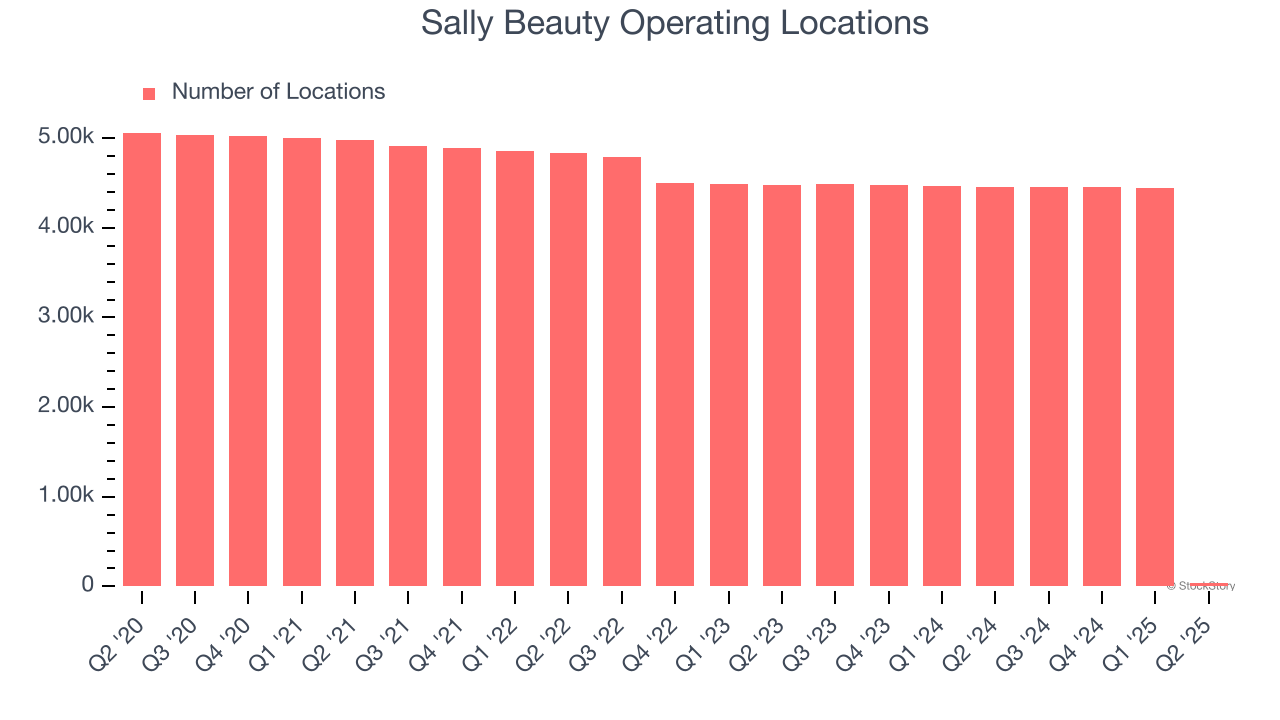
The number of stores a retailer operates is a critical driver of how quickly company-level sales can grow.
Sally Beauty listed 35 locations in the latest quarter and has generally closed its stores over the last two years, averaging 13.6% annual declines.
When a retailer shutters stores, it usually means that brick-and-mortar demand is less than supply, and it is responding by closing underperforming locations to improve profitability.
Same-Store Sales
The change in a company's store base only tells one side of the story. The other is the performance of its existing locations and e-commerce sales, which informs management teams whether they should expand or downsize their physical footprints. Same-store sales provides a deeper understanding of this issue because it measures organic growth at brick-and-mortar shops for at least a year.
Sally Beauty’s demand within its existing locations has barely increased over the last two years as its same-store sales were flat. This performance isn’t ideal, and Sally Beauty is attempting to boost same-store sales by closing stores (fewer locations sometimes lead to higher same-store sales).
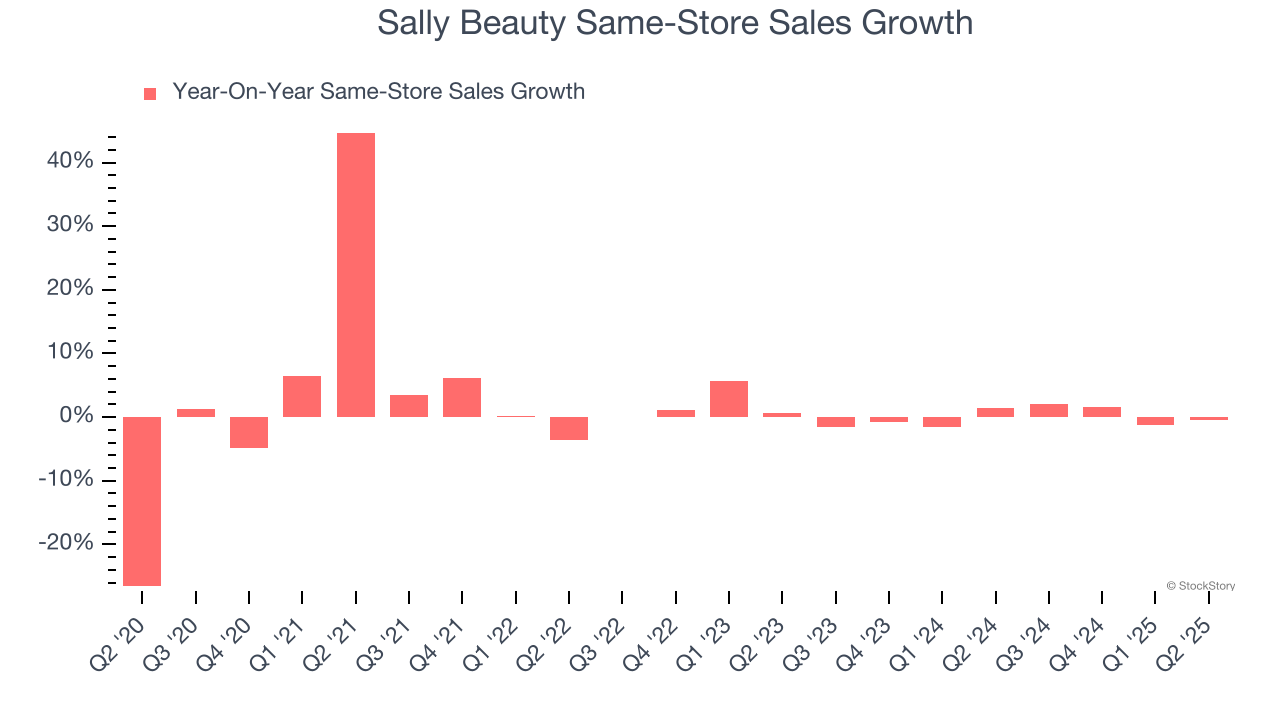
In the latest quarter, Sally Beauty’s year on year same-store sales were flat. This performance was more or less in line with its historical levels.
Key Takeaways from Sally Beauty’s Q2 Results
We were impressed by how significantly Sally Beauty blew past analysts’ EBITDA expectations this quarter. We were also glad its EPS outperformed Wall Street’s estimates. Zooming out, we think this quarter featured some important positives. The stock traded up 7.4% to $10.71 immediately after reporting.
Sure, Sally Beauty had a solid quarter, but if we look at the bigger picture, is this stock a buy? If you’re making that decision, you should consider the bigger picture of valuation, business qualities, as well as the latest earnings. We cover that in our actionable full research report which you can read here, it’s free.