
Solar energy systems company Shoals (NASDAQ: SHLS) beat Wall Street’s revenue expectations in Q2 CY2025, with sales up 11.7% year on year to $110.8 million. On top of that, next quarter’s revenue guidance ($130 million at the midpoint) was surprisingly good and 7.8% above what analysts were expecting. Its non-GAAP profit of $0.10 per share was 19.3% above analysts’ consensus estimates.
Is now the time to buy Shoals? Find out by accessing our full research report, it’s free.
Shoals (SHLS) Q2 CY2025 Highlights:
- Revenue: $110.8 million vs analyst estimates of $104.3 million (11.7% year-on-year growth, 6.3% beat)
- Adjusted EPS: $0.10 vs analyst estimates of $0.08 (19.3% beat)
- Adjusted EBITDA: $24.47 million vs analyst estimates of $23.93 million (22.1% margin, 2.3% beat)
- The company lifted its revenue guidance for the full year to $460 million at the midpoint from $430 million, a 7% increase
- EBITDA guidance for the full year is $107.5 million at the midpoint, above analyst estimates of $106 million
- Operating Margin: 14.4%, down from 18.7% in the same quarter last year
- Free Cash Flow was -$26.04 million, down from $35.84 million in the same quarter last year
- Backlog: $671.3 million at quarter end, up 4.5% year on year
- Market Capitalization: $899.4 million
“The year is shaping up to be very strong. We delivered revenue above the high end of our guided range, and ended the period with record backlog and awarded orders of $671.3 million. Our strategy of accelerating growth within our core domestic utility scale markets is yielding results. We continue to be very encouraged by the traction we are seeing within our four growth initiatives, which are providing exposure to new markets, customers, and applications for Shoals,” said Brandon Moss, CEO of Shoals.
Company Overview
Started in Huntsville, Alabama, Shoals (NASDAQ: SHLS) designs and manufactures products that make solar energy systems work more efficiently.
Revenue Growth
A company’s long-term sales performance can indicate its overall quality. Any business can put up a good quarter or two, but the best consistently grow over the long haul. Thankfully, Shoals’s 20.5% annualized revenue growth over the last five years was incredible. Its growth beat the average industrials company and shows its offerings resonate with customers.
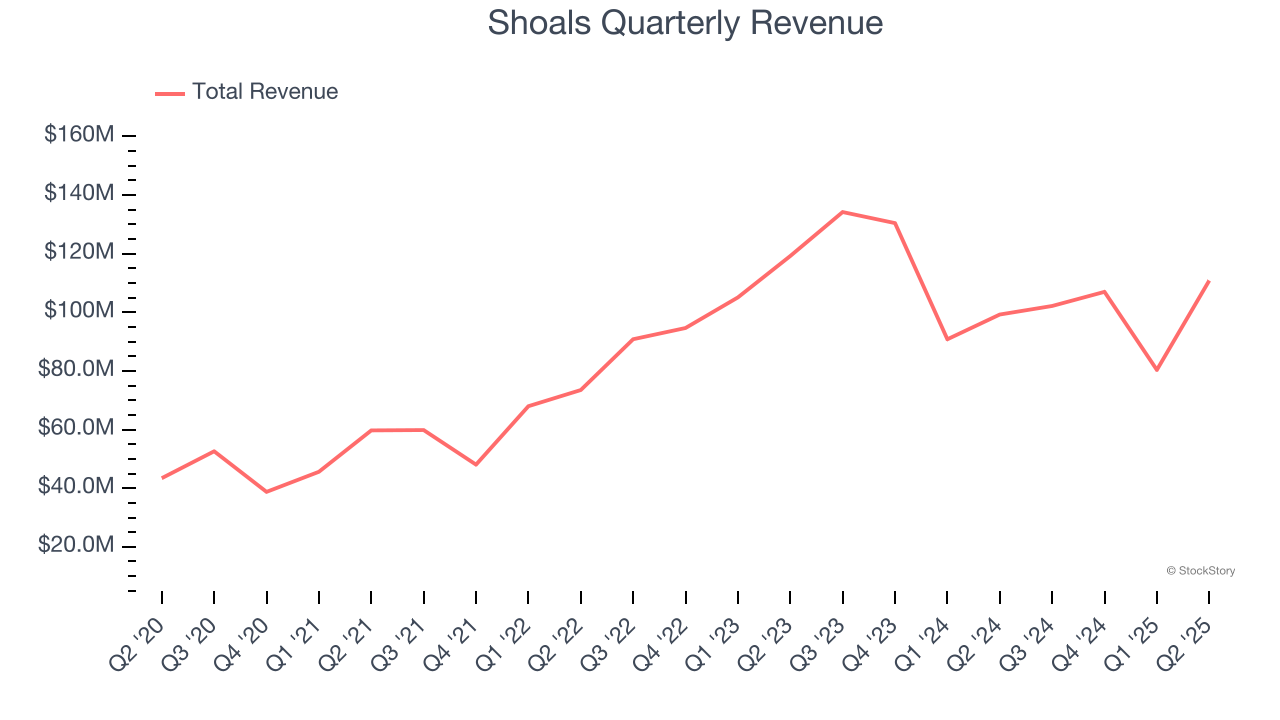
Long-term growth is the most important, but within industrials, a half-decade historical view may miss new industry trends or demand cycles. Shoals’s recent performance marks a sharp pivot from its five-year trend as its revenue has shown annualized declines of 1.2% over the last two years. Shoals isn’t alone in its struggles as the Renewable Energy industry experienced a cyclical downturn, with many similar businesses observing lower sales at this time. 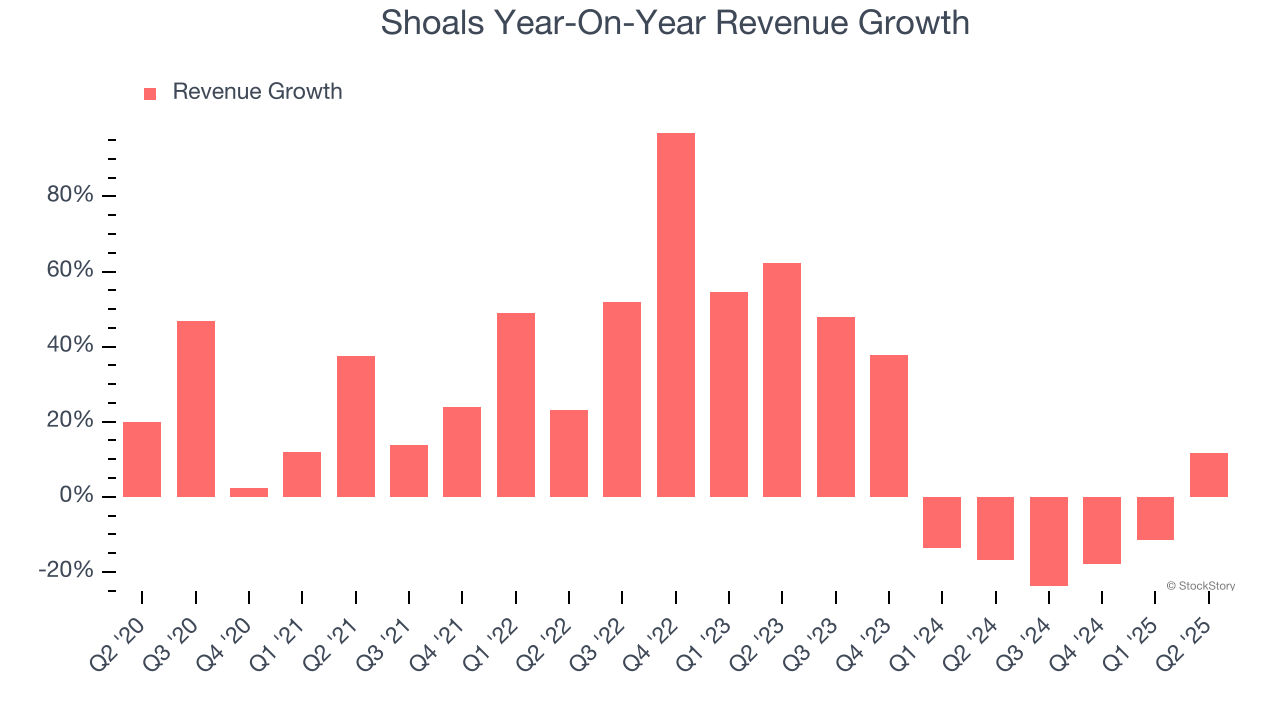
Shoals also reports its backlog, or the value of its outstanding orders that have not yet been executed or delivered. Shoals’s backlog reached $671.3 million in the latest quarter and averaged 3.3% year-on-year growth over the last two years. Because this number is better than its revenue growth, we can see the company accumulated more orders than it could fulfill and deferred revenue to the future. This could imply elevated demand for Shoals’s products and services but raises concerns about capacity constraints. 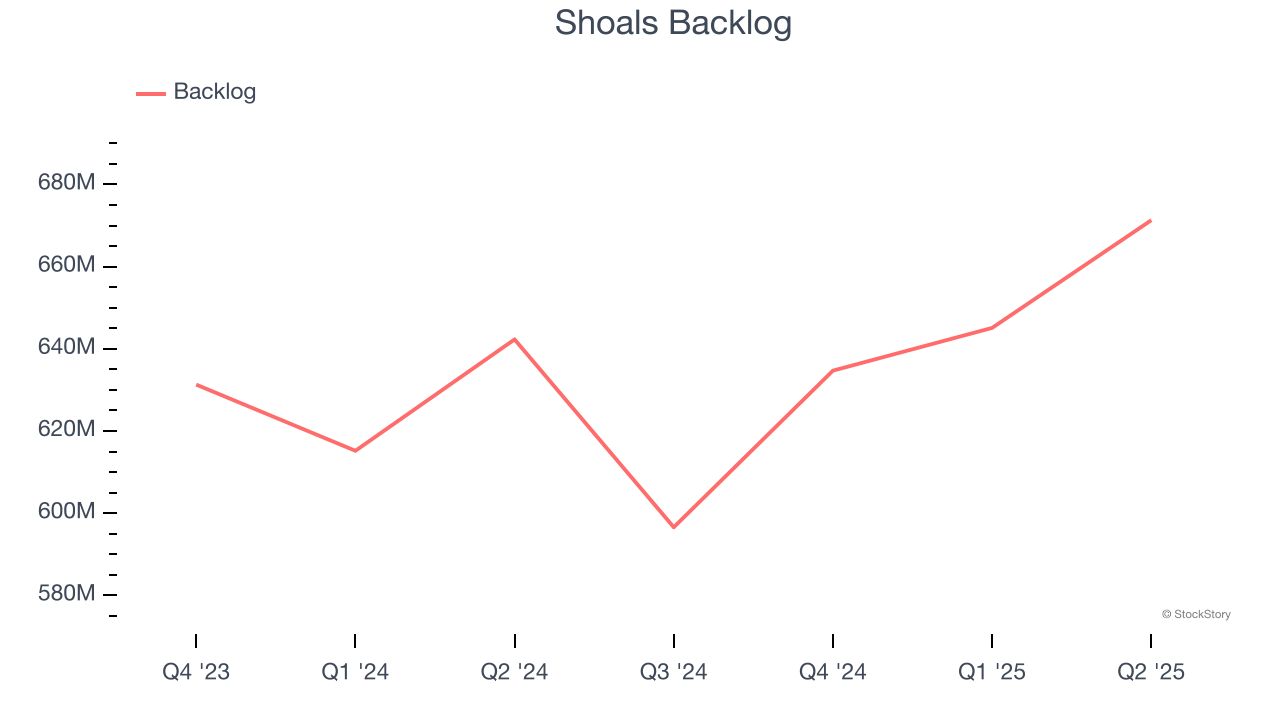
This quarter, Shoals reported year-on-year revenue growth of 11.7%, and its $110.8 million of revenue exceeded Wall Street’s estimates by 6.3%. Company management is currently guiding for a 27.2% year-on-year increase in sales next quarter.
Looking further ahead, sell-side analysts expect revenue to grow 18.4% over the next 12 months, an improvement versus the last two years. This projection is eye-popping and indicates its newer products and services will spur better top-line performance.
Unless you’ve been living under a rock, it should be obvious by now that generative AI is going to have a huge impact on how large corporations do business. While Nvidia and AMD are trading close to all-time highs, we prefer a lesser-known (but still profitable) stock benefiting from the rise of AI. Click here to access our free report one of our favorites growth stories.
Operating Margin
Shoals has been a well-oiled machine over the last five years. It demonstrated elite profitability for an industrials business, boasting an average operating margin of 16.1%. This result isn’t surprising as its high gross margin gives it a favorable starting point.
Looking at the trend in its profitability, Shoals’s operating margin decreased by 13.2 percentage points over the last five years. This raises questions about the company’s expense base because its revenue growth should have given it leverage on its fixed costs, resulting in better economies of scale and profitability.
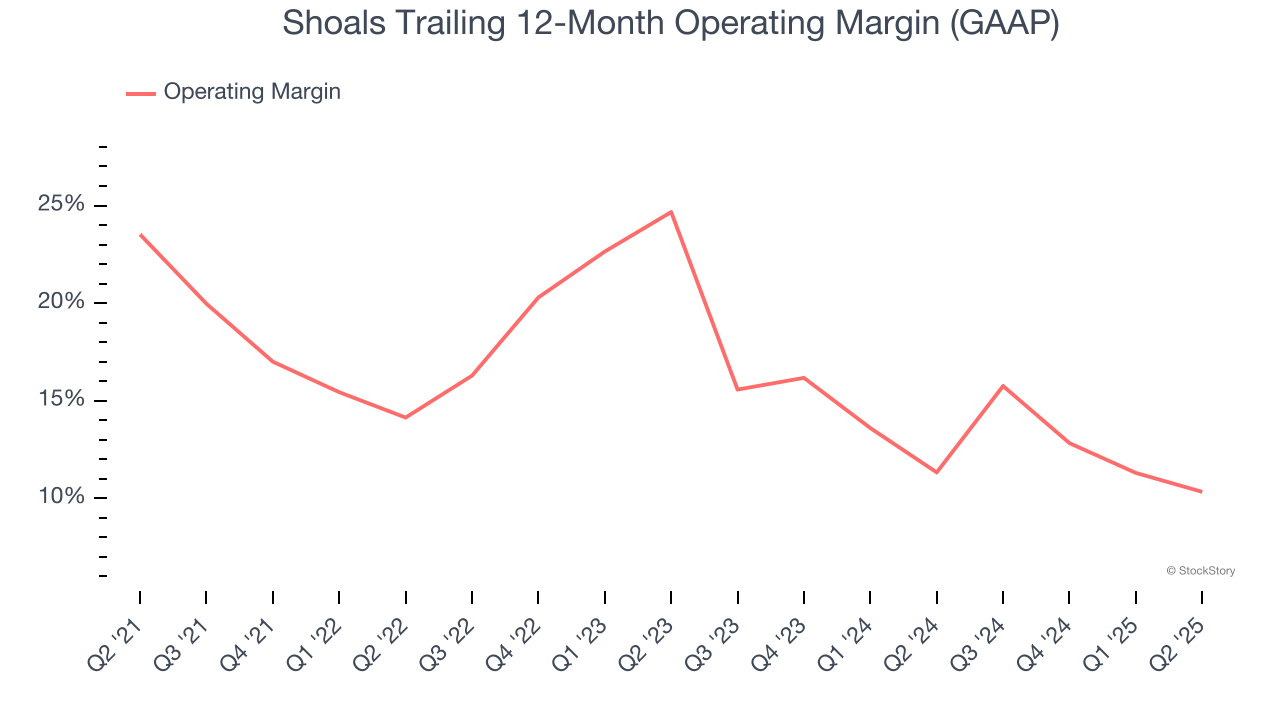
This quarter, Shoals generated an operating margin profit margin of 14.4%, down 4.3 percentage points year on year. Since Shoals’s operating margin decreased more than its gross margin, we can assume it was less efficient because expenses such as marketing, R&D, and administrative overhead increased.
Earnings Per Share
Revenue trends explain a company’s historical growth, but the long-term change in earnings per share (EPS) points to the profitability of that growth – for example, a company could inflate its sales through excessive spending on advertising and promotions.
Shoals’s full-year EPS was flat over the last four years, worse than the broader industrials sector.
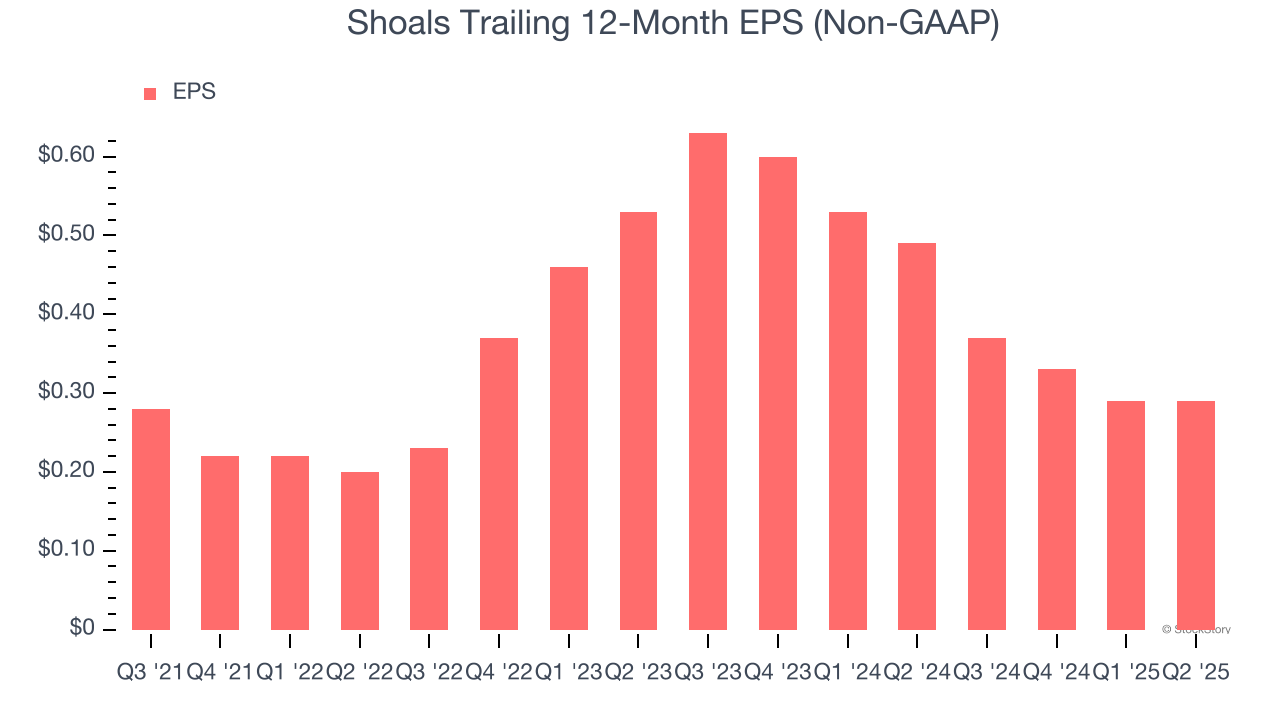
Like with revenue, we analyze EPS over a shorter period to see if we are missing a change in the business.
Sadly for Shoals, its EPS declined by more than its revenue over the last two years, dropping 26%. This tells us the company struggled to adjust to shrinking demand.
Diving into the nuances of Shoals’s earnings can give us a better understanding of its performance. Shoals’s operating margin has declined by 12.1 percentage points over the last two years. This was the most relevant factor (aside from the revenue impact) behind its lower earnings; interest expenses and taxes can also affect EPS but don’t tell us as much about a company’s fundamentals.
In Q2, Shoals reported adjusted EPS at $0.10, in line with the same quarter last year. This print easily cleared analysts’ estimates, and shareholders should be content with the results. Over the next 12 months, Wall Street expects Shoals to perform poorly. Analysts forecast its full-year EPS of $0.29 will hit $0.45.
Key Takeaways from Shoals’s Q2 Results
We were impressed by how significantly Shoals blew past analysts’ revenue expectations this quarter. We were also glad its revenue guidance for next quarter trumped Wall Street’s estimates. Zooming out, we think this was a good print with some key areas of upside. The stock traded up 7.7% to $5.78 immediately after reporting.
Shoals put up rock-solid earnings, but one quarter doesn’t necessarily make the stock a buy. Let’s see if this is a good investment. If you’re making that decision, you should consider the bigger picture of valuation, business qualities, as well as the latest earnings. We cover that in our actionable full research report which you can read here, it’s free.


