
Healthcare company Surgery Partners (NASDAQ: SGRY) beat Wall Street’s revenue expectations in Q2 CY2025, with sales up 8.4% year on year to $826.2 million. The company expects the full year’s revenue to be around $3.38 billion, close to analysts’ estimates. Its non-GAAP profit of $0.17 per share was 25.8% above analysts’ consensus estimates.
Is now the time to buy Surgery Partners? Find out by accessing our full research report, it’s free.
Surgery Partners (SGRY) Q2 CY2025 Highlights:
- Revenue: $826.2 million vs analyst estimates of $816.1 million (8.4% year-on-year growth, 1.2% beat)
- Adjusted EPS: $0.17 vs analyst estimates of $0.14 (25.8% beat)
- Adjusted EBITDA: $129 million vs analyst estimates of $128.2 million (15.6% margin, 0.6% beat)
- The company reconfirmed its revenue guidance for the full year of $3.38 billion at the midpoint
- EBITDA guidance for the full year is $560 million at the midpoint, in line with analyst expectations
- Operating Margin: 13.5%, up from 11.1% in the same quarter last year
- Free Cash Flow Margin: 7%, similar to the same quarter last year
- Sales Volumes rose 3.4% year on year, in line with the same quarter last year
- Market Capitalization: $2.83 billion
Company Overview
With more than 180 locations across 33 states serving as alternatives to traditional hospital settings, Surgery Partners (NASDAQ: SGRY) operates a national network of outpatient surgical facilities including ambulatory surgery centers and short-stay surgical hospitals.
Revenue Growth
Examining a company’s long-term performance can provide clues about its quality. Even a bad business can shine for one or two quarters, but a top-tier one grows for years. Over the last five years, Surgery Partners grew its sales at a solid 12.6% compounded annual growth rate. Its growth beat the average healthcare company and shows its offerings resonate with customers.
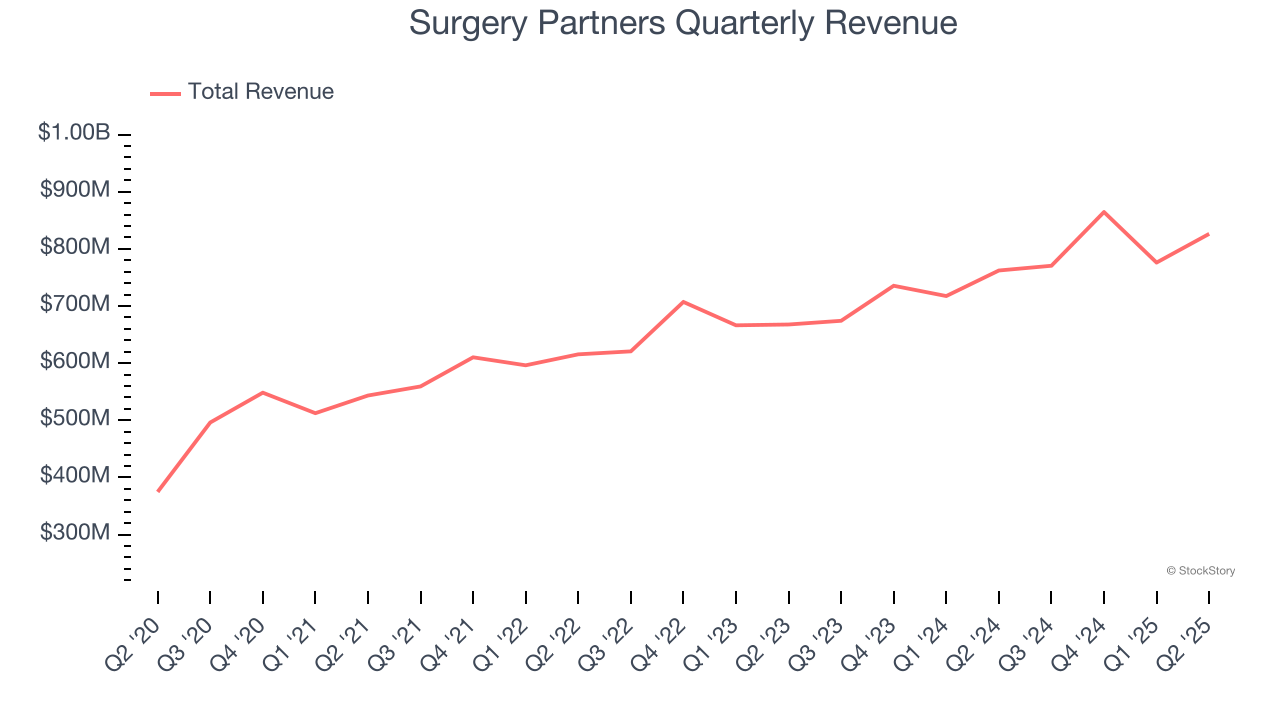
We at StockStory place the most emphasis on long-term growth, but within healthcare, a half-decade historical view may miss recent innovations or disruptive industry trends. Surgery Partners’s annualized revenue growth of 10.3% over the last two years is below its five-year trend, but we still think the results were respectable. 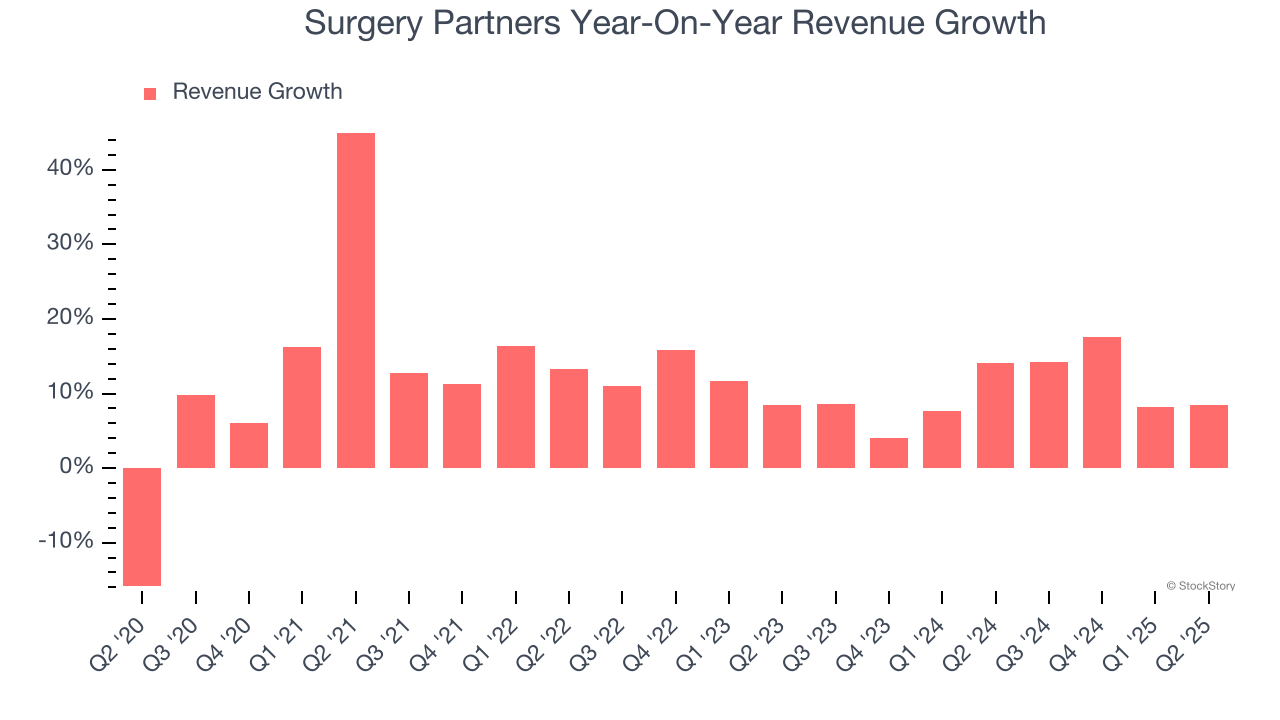
Surgery Partners also reports its number of units sold. Over the last two years, Surgery Partners’s units sold averaged 3.1% year-on-year growth. Because this number is lower than its revenue growth, we can see the company benefited from price increases. 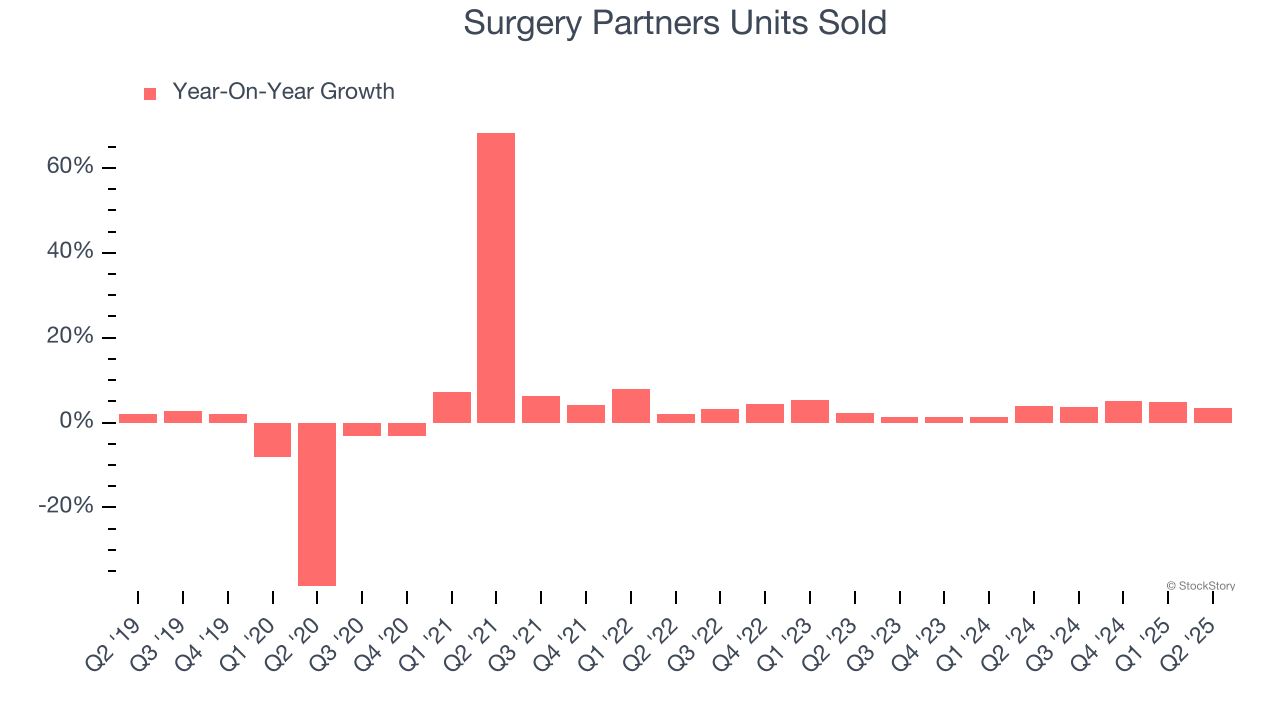
This quarter, Surgery Partners reported year-on-year revenue growth of 8.4%, and its $826.2 million of revenue exceeded Wall Street’s estimates by 1.2%.
Looking ahead, sell-side analysts expect revenue to grow 9.1% over the next 12 months, similar to its two-year rate. Still, this projection is healthy and indicates the market is baking in success for its products and services.
Today’s young investors won’t have read the timeless lessons in Gorilla Game: Picking Winners In High Technology because it was written more than 20 years ago when Microsoft and Apple were first establishing their supremacy. But if we apply the same principles, then enterprise software stocks leveraging their own generative AI capabilities may well be the Gorillas of the future. So, in that spirit, we are excited to present our Special Free Report on a profitable, fast-growing enterprise software stock that is already riding the automation wave and looking to catch the generative AI next.
Operating Margin
Surgery Partners’s operating margin might fluctuated slightly over the last 12 months but has generally stayed the same, averaging 12.2% over the last five years. This profitability was higher than the broader healthcare sector, showing it did a decent job managing its expenses.
Analyzing the trend in its profitability, Surgery Partners’s operating margin might fluctuated slightly but has generally stayed the same over the last five years. This raises questions about the company’s expense base because its revenue growth should have given it leverage on its fixed costs, resulting in better economies of scale and profitability.
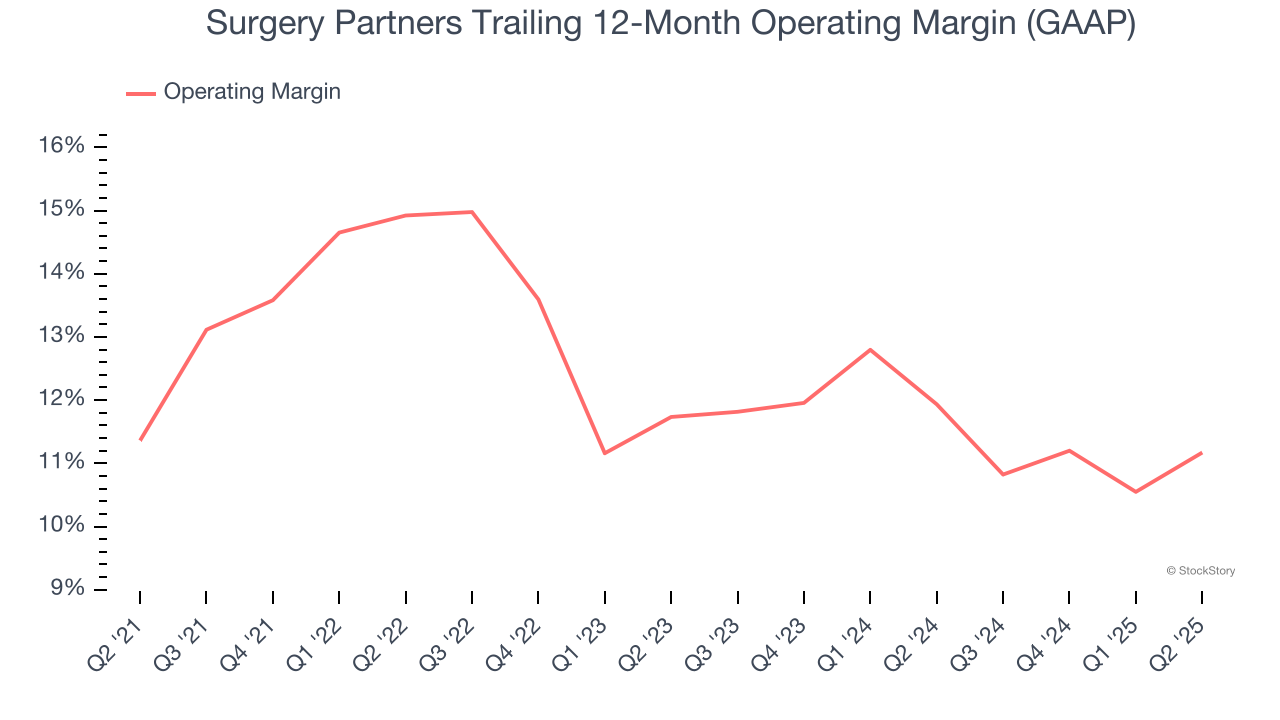
This quarter, Surgery Partners generated an operating margin profit margin of 13.5%, up 2.4 percentage points year on year. This increase was a welcome development and shows it was more efficient.
Earnings Per Share
We track the long-term change in earnings per share (EPS) for the same reason as long-term revenue growth. Compared to revenue, however, EPS highlights whether a company’s growth is profitable.
Surgery Partners’s full-year EPS flipped from negative to positive over the last five years. This is encouraging and shows it’s at a critical moment in its life.
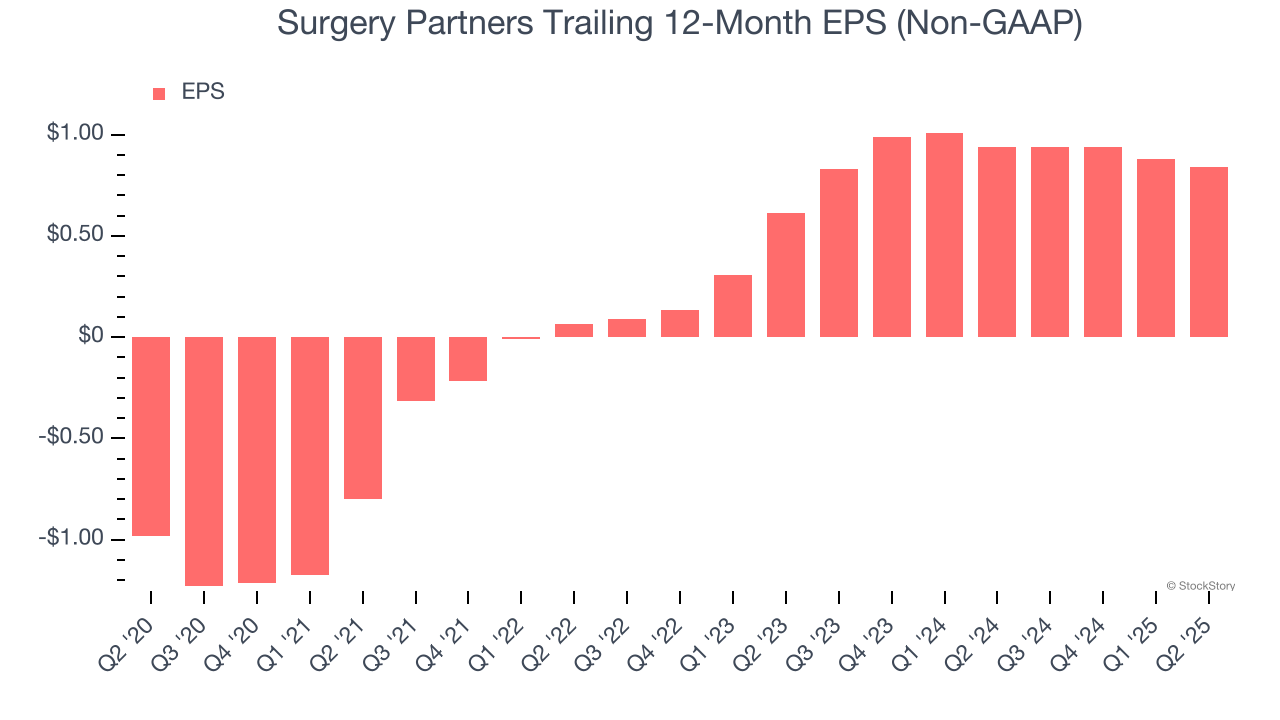
In Q2, Surgery Partners reported adjusted EPS at $0.17, down from $0.21 in the same quarter last year. Despite falling year on year, this print easily cleared analysts’ estimates. Over the next 12 months, Wall Street expects Surgery Partners’s full-year EPS of $0.84 to grow 13.5%.
Key Takeaways from Surgery Partners’s Q2 Results
We were impressed by how significantly Surgery Partners blew past analysts’ EPS expectations this quarter. We were also happy its revenue narrowly outperformed Wall Street’s estimates. Full-year revenue guidance was reaffirmed, showing that the business is on track. Overall, this print had some key positives. The stock traded up 2.6% to $22.80 immediately after reporting.
Surgery Partners may have had a good quarter, but does that mean you should invest right now? If you’re making that decision, you should consider the bigger picture of valuation, business qualities, as well as the latest earnings. We cover that in our actionable full research report which you can read here, it’s free.