Fast-food company Yum! Brands (NYSE: YUM) met Wall Street’s revenue expectations in Q2 CY2025, with sales up 9.6% year on year to $1.93 billion. Its non-GAAP profit of $1.44 per share was 1.3% below analysts’ consensus estimates.
Is now the time to buy Yum! Brands? Find out by accessing our full research report, it’s free.
Yum! Brands (YUM) Q2 CY2025 Highlights:
- Revenue: $1.93 billion vs analyst estimates of $1.94 billion (9.6% year-on-year growth, in line)
- Adjusted EPS: $1.44 vs analyst expectations of $1.46 (1.3% miss)
- Adjusted EBITDA: $645 million vs analyst estimates of $700.3 million (33.4% margin, 7.9% miss)
- Operating Margin: 32.2%, down from 34.4% in the same quarter last year
- Free Cash Flow Margin: 19.4%, up from 16.6% in the same quarter last year
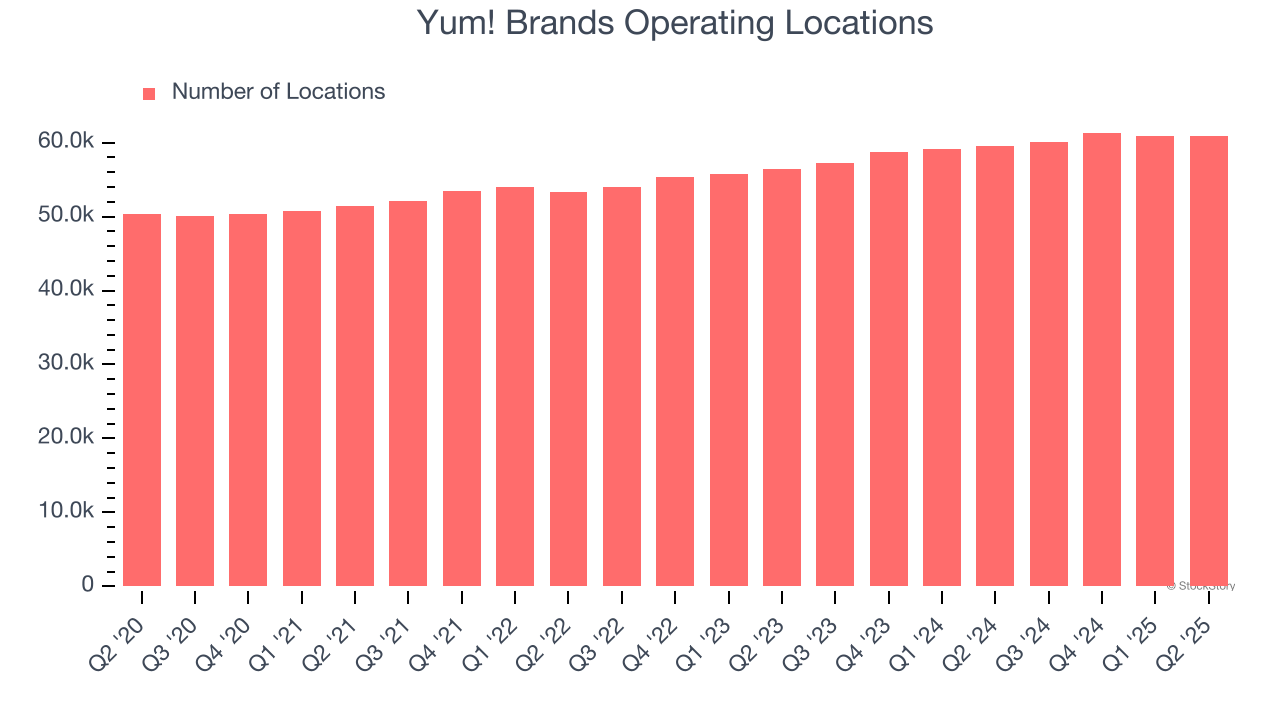
- Locations: 60,893 at quarter end, up from 59,498 in the same quarter last year
- Same-Store Sales rose 2% year on year (-1% in the same quarter last year)
- Market Capitalization: $40.86 billion
Company Overview
Spun off as an independent company from PepsiCo, Yum! Brands (NYSE: YUM) is a multinational corporation that owns KFC, Pizza Hut, Taco Bell, and The Habit Burger Grill.
Revenue Growth
A company’s long-term performance is an indicator of its overall quality. Any business can put up a good quarter or two, but the best consistently grow over the long haul.
With $7.91 billion in revenue over the past 12 months, Yum! Brands is larger than most restaurant chains and benefits from economies of scale, enabling it to gain more leverage on its fixed costs than smaller competitors. Its size also gives it negotiating leverage with suppliers, allowing it to source its ingredients at a lower cost. However, its scale is a double-edged sword because there are only a finite of number places to build restaurants, making it harder to find incremental growth. To accelerate system-wide sales, Yum! Brands likely needs to optimize its pricing or lean into new chains and international expansion.
As you can see below, Yum! Brands’s sales grew at a mediocre 6.2% compounded annual growth rate over the last six years (we compare to 2019 to normalize for COVID-19 impacts).
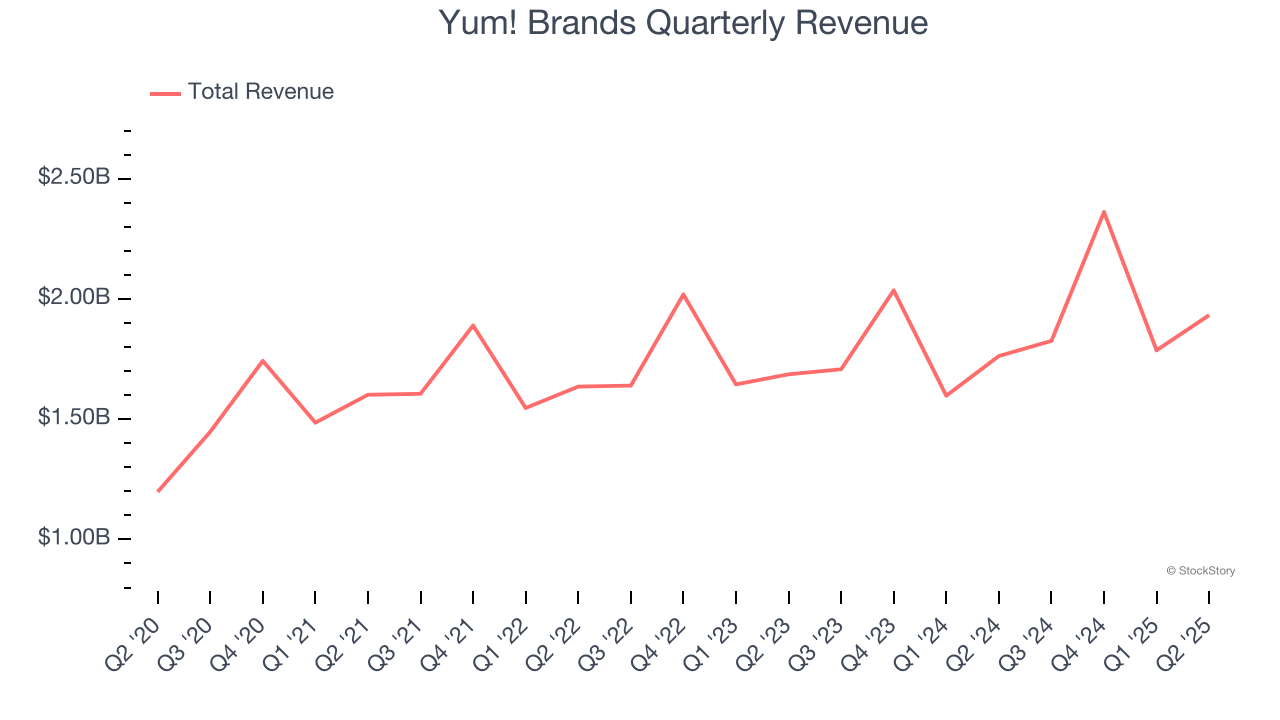
This quarter, Yum! Brands grew its revenue by 9.6% year on year, and its $1.93 billion of revenue was in line with Wall Street’s estimates.
Looking ahead, sell-side analysts expect revenue to grow 5% over the next 12 months, similar to its six-year rate. This projection doesn't excite us and implies its menu offerings will face some demand challenges. At least the company is tracking well in other measures of financial health.
Unless you’ve been living under a rock, it should be obvious by now that generative AI is going to have a huge impact on how large corporations do business. While Nvidia and AMD are trading close to all-time highs, we prefer a lesser-known (but still profitable) stock benefiting from the rise of AI. Click here to access our free report one of our favorites growth stories.
Restaurant Performance
Number of Restaurants
A restaurant chain’s total number of dining locations often determines how much revenue it can generate.
Yum! Brands operated 60,893 locations in the latest quarter. It has opened new restaurants at a rapid clip over the last two years, averaging 4.8% annual growth, much faster than the broader restaurant sector. Additionally, one dynamic making expansion more seamless is the company’s franchise model, where franchisees are primarily responsible for opening new restaurants while Yum! Brands provides support.
When a chain opens new restaurants, it usually means it’s investing for growth because there’s healthy demand for its meals and there are markets where its concepts have few or no locations.
Same-Store Sales
The change in a company's restaurant base only tells one side of the story. The other is the performance of its existing locations, which informs management teams whether they should expand or downsize their physical footprints. Same-store sales gives us insight into this topic because it measures organic growth at restaurants open for at least a year.
Yum! Brands’s demand within its existing dining locations has barely increased over the last two years as its same-store sales were flat. Yum! Brands should consider improving its foot traffic and efficiency before expanding its restaurant base.
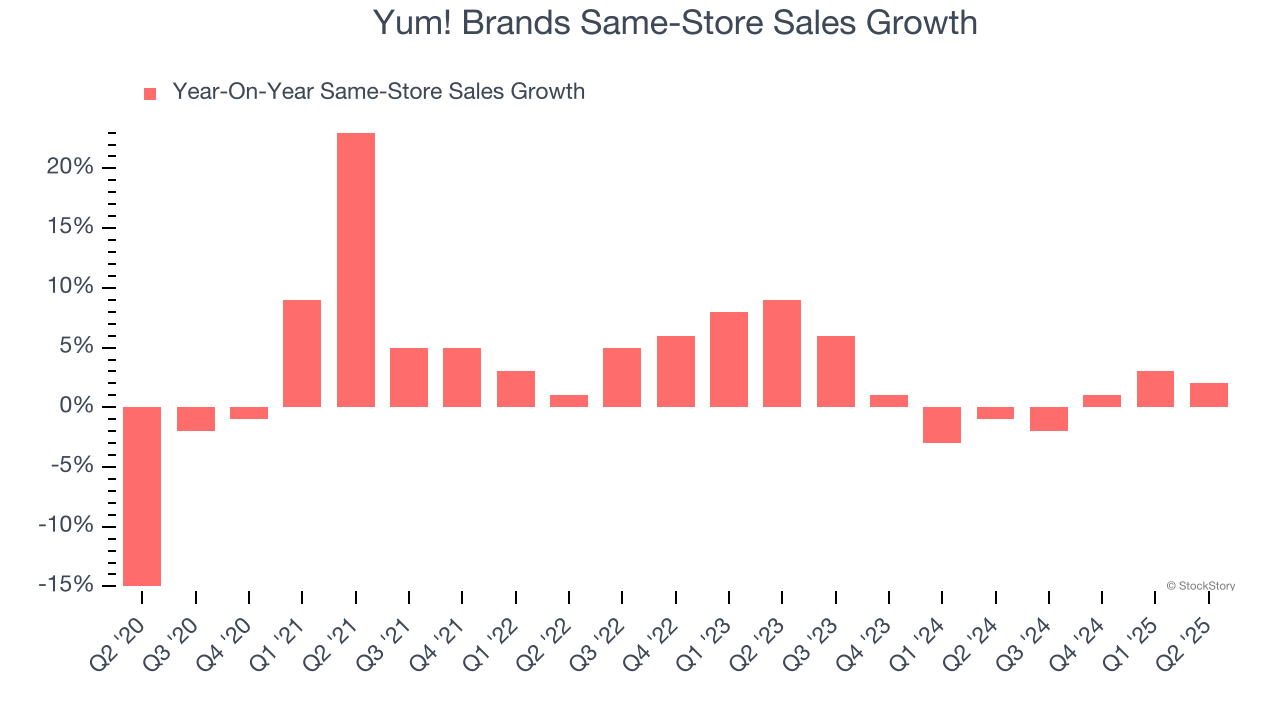
In the latest quarter, Yum! Brands’s same-store sales rose 2% year on year. This growth was an acceleration from its historical levels, which is always an encouraging sign.
Key Takeaways from Yum! Brands’s Q2 Results
We struggled to find many positives in these results as its U.S. KFC and Pizza Hut divisions saw same-store sales declines, contributing to its EPS and EBITDA misses. Overall, this was a softer quarter. The stock traded down 2.7% to $143.25 immediately following the results.
Yum! Brands didn’t show it’s best hand this quarter, but does that create an opportunity to buy the stock right now? What happened in the latest quarter matters, but not as much as longer-term business quality and valuation, when deciding whether to invest in this stock. We cover that in our actionable full research report which you can read here, it’s free.