Landscaping service company BrightView (NYSE: BV) missed Wall Street’s revenue expectations in Q2 CY2025, with sales falling 4.1% year on year to $708.3 million. On the other hand, the company’s outlook for the full year was close to analysts’ estimates with revenue guided to $2.71 billion at the midpoint. Its non-GAAP profit of $0.30 per share was 10.7% below analysts’ consensus estimates.
Is now the time to buy BrightView? Find out by accessing our full research report, it’s free.
BrightView (BV) Q2 CY2025 Highlights:
- Revenue: $708.3 million vs analyst estimates of $721.8 million (4.1% year-on-year decline, 1.9% miss)
- Adjusted EPS: $0.30 vs analyst expectations of $0.34 (10.7% miss)
- Adjusted EBITDA: $113.2 million vs analyst estimates of $112.9 million (16% margin, in line)
- The company dropped its revenue guidance for the full year to $2.71 billion at the midpoint from $2.80 billion, a 3.2% decrease
- EBITDA guidance for the full year is $355 million at the midpoint, above analyst estimates of $351.4 million
- Operating Margin: 8.1%, up from 6.6% in the same quarter last year
- Free Cash Flow Margin: 22.5%, up from 4.2% in the same quarter last year
- Market Capitalization: $1.54 billion
Company Overview
An official field consultant for Major League Baseball, BrightView (NYSE: BV) offers landscaping design, development, and maintenance.
Revenue Growth
A company’s long-term sales performance is one signal of its overall quality. Any business can put up a good quarter or two, but the best consistently grow over the long haul. Over the last five years, BrightView grew its sales at a sluggish 2.7% compounded annual growth rate. This fell short of our benchmarks and is a poor baseline for our analysis.
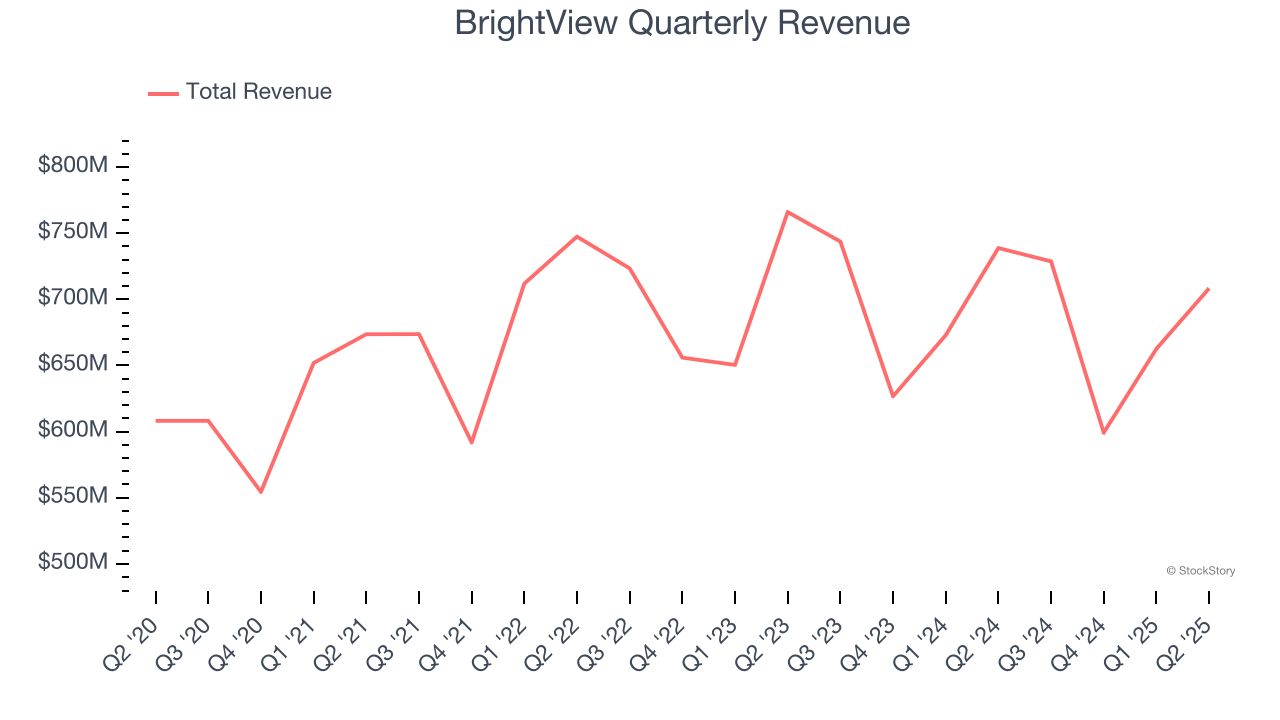
We at StockStory place the most emphasis on long-term growth, but within industrials, a half-decade historical view may miss cycles, industry trends, or a company capitalizing on catalysts such as a new contract win or a successful product line. BrightView’s performance shows it grew in the past but relinquished its gains over the last two years, as its revenue fell by 1.7% annually. 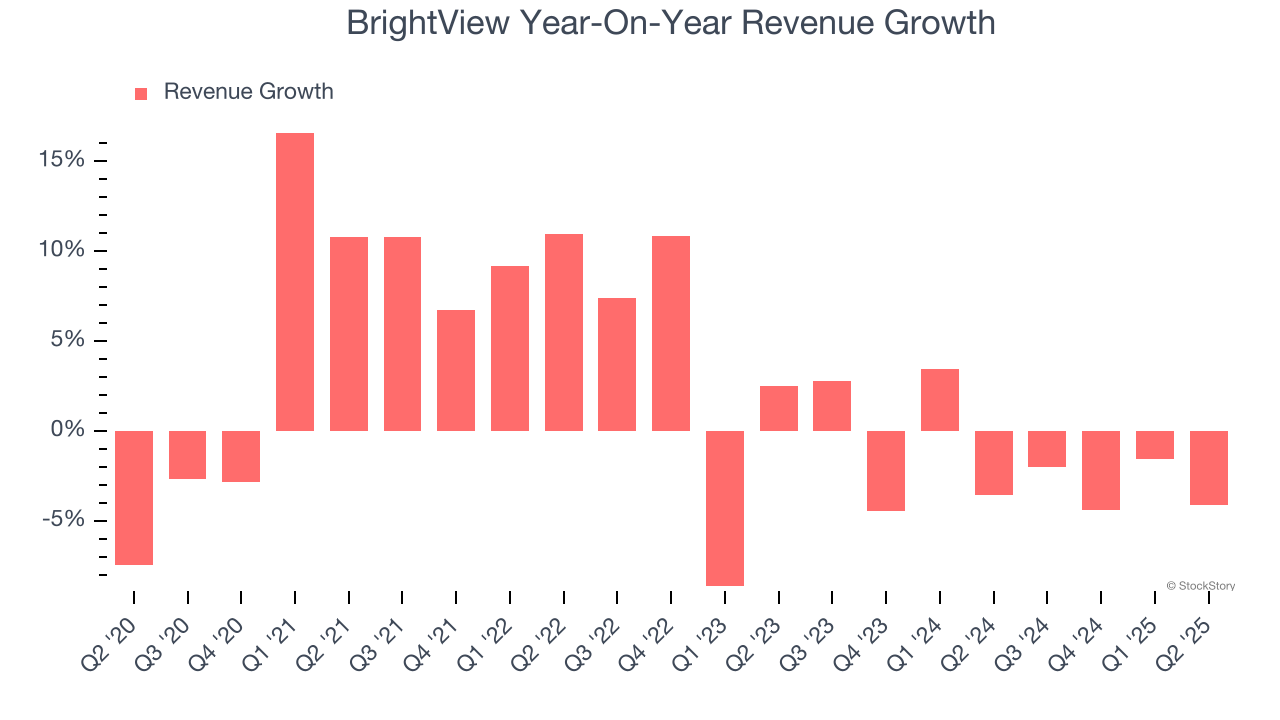
This quarter, BrightView missed Wall Street’s estimates and reported a rather uninspiring 4.1% year-on-year revenue decline, generating $708.3 million of revenue.
Looking ahead, sell-side analysts expect revenue to grow 2.7% over the next 12 months. While this projection suggests its newer products and services will catalyze better top-line performance, it is still below the sector average.
Today’s young investors won’t have read the timeless lessons in Gorilla Game: Picking Winners In High Technology because it was written more than 20 years ago when Microsoft and Apple were first establishing their supremacy. But if we apply the same principles, then enterprise software stocks leveraging their own generative AI capabilities may well be the Gorillas of the future. So, in that spirit, we are excited to present our Special Free Report on a profitable, fast-growing enterprise software stock that is already riding the automation wave and looking to catch the generative AI next.
Operating Margin
BrightView was profitable over the last five years but held back by its large cost base. Its average operating margin of 3.9% was weak for an industrials business. This result isn’t too surprising given its low gross margin as a starting point.
On the plus side, BrightView’s operating margin rose by 2.2 percentage points over the last five years, as its sales growth gave it operating leverage.
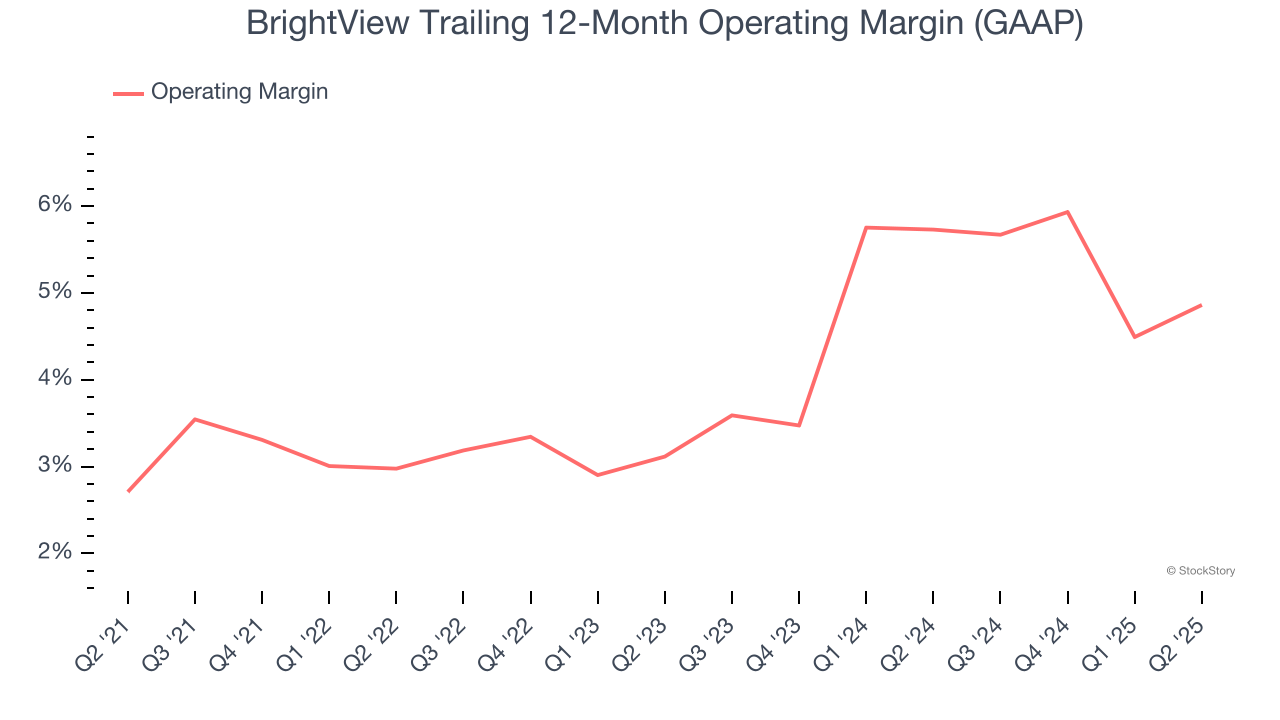
This quarter, BrightView generated an operating margin profit margin of 8.1%, up 1.5 percentage points year on year. The increase was encouraging, and because its operating margin rose more than its gross margin, we can infer it was more efficient with expenses such as marketing, R&D, and administrative overhead.
Earnings Per Share
Revenue trends explain a company’s historical growth, but the long-term change in earnings per share (EPS) points to the profitability of that growth – for example, a company could inflate its sales through excessive spending on advertising and promotions.
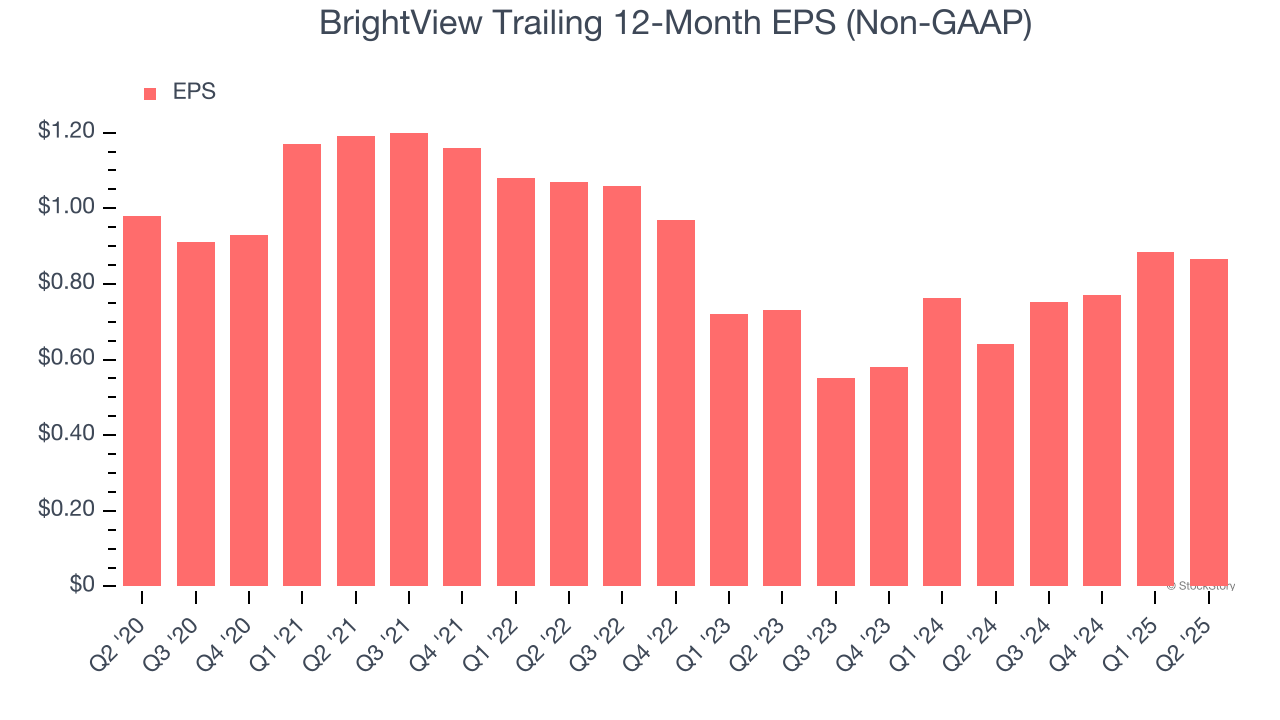
Sadly for BrightView, its EPS declined by 2.5% annually over the last five years while its revenue grew by 2.7%. We can see the difference stemmed from higher interest expenses or taxes as the company actually improved its operating margin and repurchased its shares during this time.
Like with revenue, we analyze EPS over a shorter period to see if we are missing a change in the business.
BrightView’s two-year annual EPS growth of 8.9% was decent and topped its two-year revenue performance.
Diving into BrightView’s quality of earnings can give us a better understanding of its performance. BrightView’s operating margin has expanded by 1.4 percentage points over the last two years. This was the most relevant factor (aside from the revenue impact) behind its higher earnings; interest expenses and taxes can also affect EPS but don’t tell us as much about a company’s fundamentals.
In Q2, BrightView reported adjusted EPS at $0.30, down from $0.32 in the same quarter last year. This print missed analysts’ estimates. Over the next 12 months, Wall Street expects BrightView’s full-year EPS of $0.87 to grow 4.2%.
Key Takeaways from BrightView’s Q2 Results
It was good to see BrightView provide full-year EBITDA guidance that slightly beat analysts’ expectations. On the other hand, its EPS missed and its revenue fell short of Wall Street’s estimates. Overall, this was a weaker quarter. The stock remained flat at $16.28 immediately after reporting.
BrightView’s latest earnings report disappointed. One quarter doesn’t define a company’s quality, so let’s explore whether the stock is a buy at the current price. What happened in the latest quarter matters, but not as much as longer-term business quality and valuation, when deciding whether to invest in this stock. We cover that in our actionable full research report which you can read here, it’s free.