
Customer experience software company CSG Systems (NASDAQ: CSGS) reported revenue ahead of Wall Street’s expectations in Q2 CY2025, with sales up 2.3% year on year to $297.1 million. The company’s full-year revenue guidance of $1.23 billion at the midpoint came in 9.9% above analysts’ estimates. Its non-GAAP profit of $1.16 per share was 10.7% above analysts’ consensus estimates.
Is now the time to buy CSG? Find out by accessing our full research report, it’s free.
CSG (CSGS) Q2 CY2025 Highlights:
- Revenue: $297.1 million vs analyst estimates of $291.7 million (2.3% year-on-year growth, 1.9% beat)
- Adjusted EPS: $1.16 vs analyst estimates of $1.05 (10.7% beat)
- Adjusted EBITDA: $67.98 million vs analyst estimates of $59.64 million (22.9% margin, 14% beat)
- The company reconfirmed its revenue guidance for the full year of $1.23 billion at the midpoint
- Management reiterated its full-year Adjusted EPS guidance of $4.78 at the midpoint
- EBITDA guidance for the full year is $263.5 million at the midpoint, in line with analyst expectations
- Operating Margin: 10%, up from 8.8% in the same quarter last year
- Free Cash Flow Margin: 13.3%, similar to the same quarter last year
- Market Capitalization: $1.71 billion
“Team CSG’s very good business results through the first half of the year enabled us to raise our profitability targets for the second consecutive quarter and up our full year non-GAAP adjusted free cash flow target. Our 19.5% non‑GAAP operating margin underscores Team CSG’s continued success in relentlessly unlocking efficiency gains across every aspect of our business,” said Brian Shepherd, President and Chief Executive Officer of CSG.
Company Overview
Powering billions of critical customer interactions annually, CSG Systems (NASDAQ: CSGS) provides cloud-based software platforms that help companies manage customer interactions, process payments, and monetize their services.
Revenue Growth
Examining a company’s long-term performance can provide clues about its quality. Any business can experience short-term success, but top-performing ones enjoy sustained growth for years.
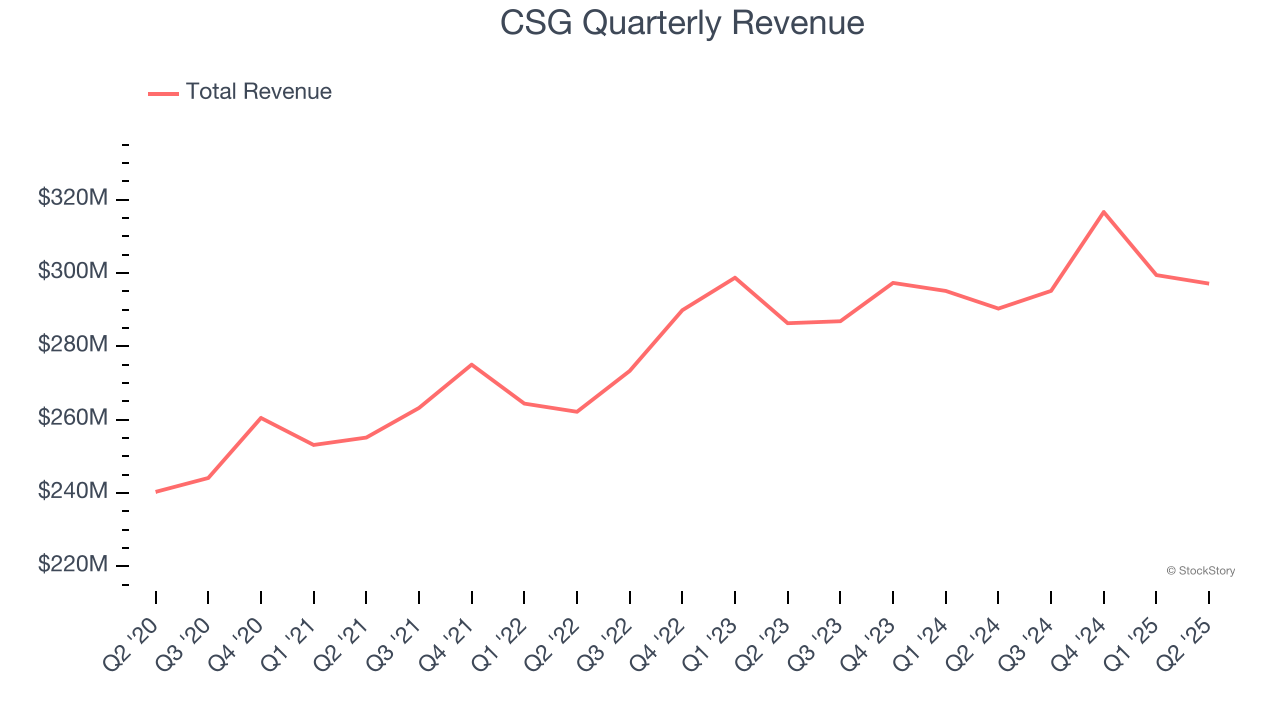
With $1.21 billion in revenue over the past 12 months, CSG is a small player in the business services space, which sometimes brings disadvantages compared to larger competitors benefiting from economies of scale and numerous distribution channels.
As you can see below, CSG’s sales grew at a mediocre 4.3% compounded annual growth rate over the last five years. This shows it couldn’t generate demand in any major way and is a tough starting point for our analysis.
We at StockStory place the most emphasis on long-term growth, but within business services, a half-decade historical view may miss recent innovations or disruptive industry trends. CSG’s recent performance shows its demand has slowed as its annualized revenue growth of 2.6% over the last two years was below its five-year trend. 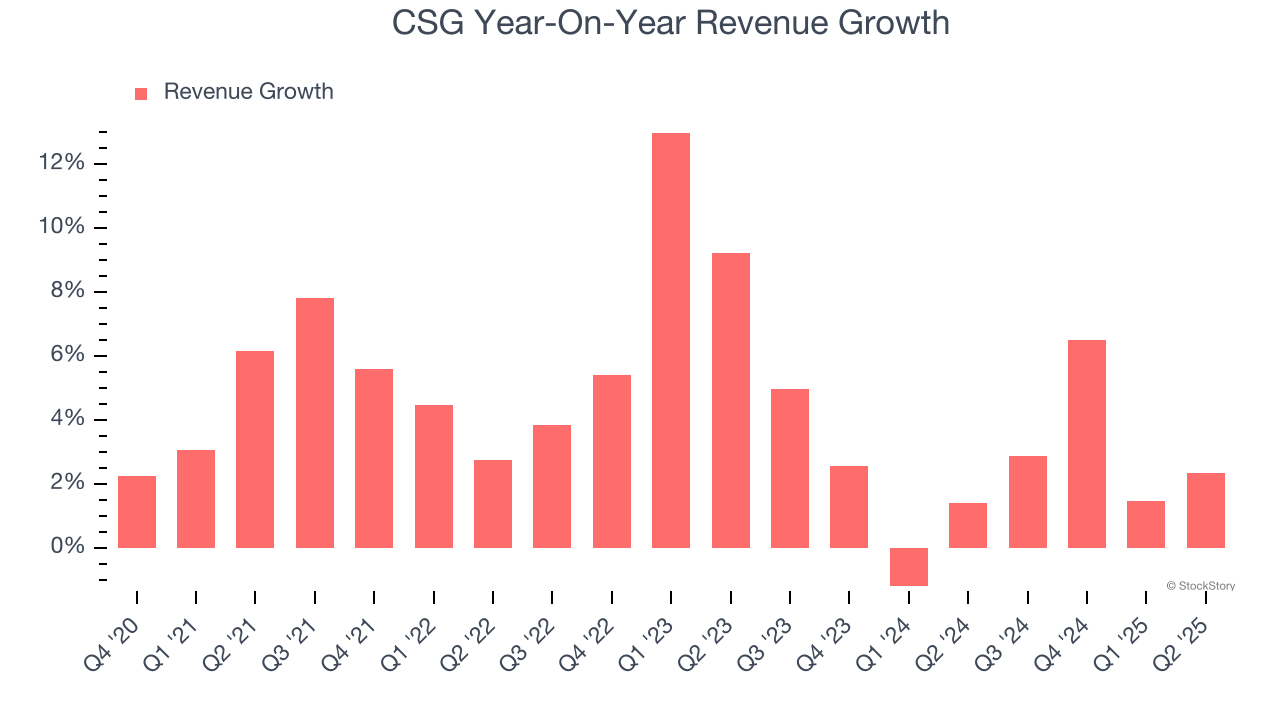
This quarter, CSG reported modest year-on-year revenue growth of 2.3% but beat Wall Street’s estimates by 1.9%.
Looking ahead, sell-side analysts expect revenue to grow 2.9% over the next 12 months, similar to its two-year rate. This projection doesn't excite us and indicates its newer products and services will not lead to better top-line performance yet.
Software is eating the world and there is virtually no industry left that has been untouched by it. That drives increasing demand for tools helping software developers do their jobs, whether it be monitoring critical cloud infrastructure, integrating audio and video functionality, or ensuring smooth content streaming. Click here to access a free report on our 3 favorite stocks to play this generational megatrend.
Operating Margin
CSG has done a decent job managing its cost base over the last five years. The company has produced an average operating margin of 10.4%, higher than the broader business services sector.
Analyzing the trend in its profitability, CSG’s operating margin decreased by 1.9 percentage points over the last five years. This raises questions about the company’s expense base because its revenue growth should have given it leverage on its fixed costs, resulting in better economies of scale and profitability.
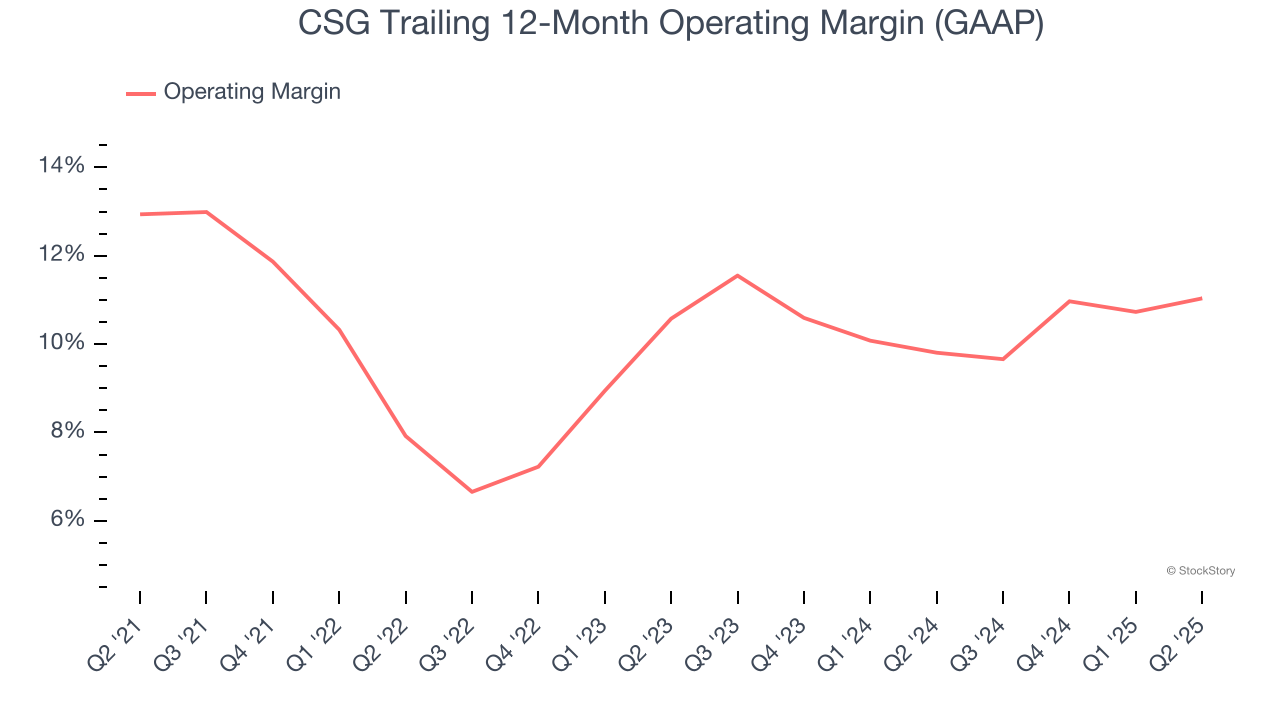
In Q2, CSG generated an operating margin profit margin of 10%, up 1.3 percentage points year on year. This increase was a welcome development and shows it was more efficient.
Earnings Per Share
Revenue trends explain a company’s historical growth, but the long-term change in earnings per share (EPS) points to the profitability of that growth – for example, a company could inflate its sales through excessive spending on advertising and promotions.
CSG’s EPS grew at a decent 8.6% compounded annual growth rate over the last five years, higher than its 4.3% annualized revenue growth. However, this alone doesn’t tell us much about its business quality because its operating margin didn’t improve.
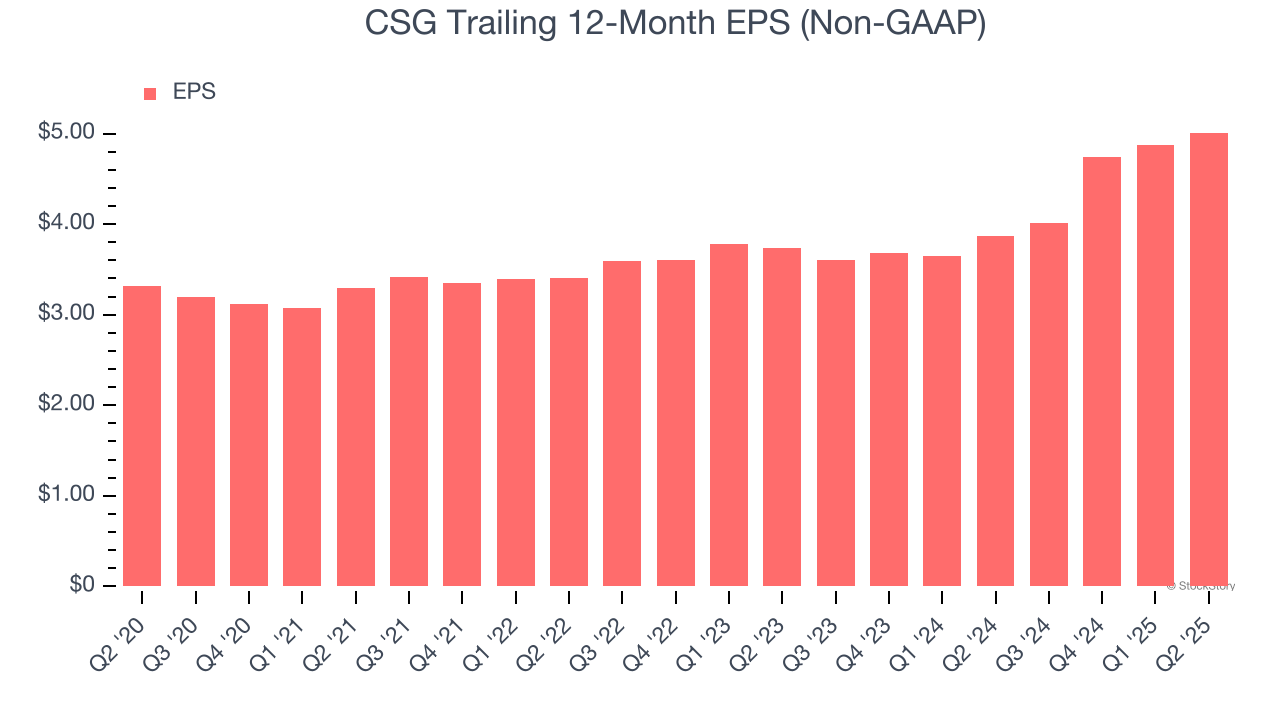
Diving into CSG’s quality of earnings can give us a better understanding of its performance. A five-year view shows that CSG has repurchased its stock, shrinking its share count by 12.8%. This tells us its EPS outperformed its revenue not because of increased operational efficiency but financial engineering, as buybacks boost per share earnings. 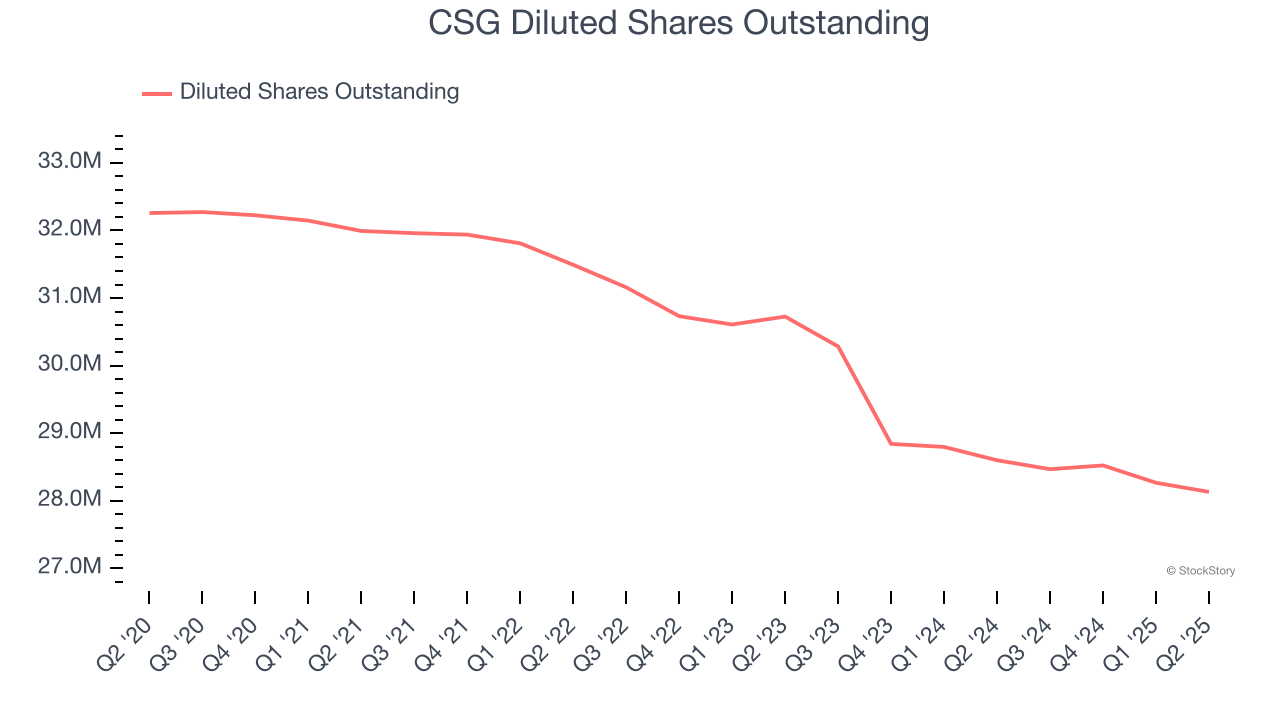
Like with revenue, we analyze EPS over a shorter period to see if we are missing a change in the business.
For CSG, its two-year annual EPS growth of 15.7% was higher than its five-year trend. This acceleration made it one of the faster-growing business services companies in recent history.
In Q2, CSG reported adjusted EPS at $1.16, up from $1.02 in the same quarter last year. This print easily cleared analysts’ estimates, and shareholders should be content with the results. Over the next 12 months, Wall Street expects CSG’s full-year EPS of $5.01 to shrink by 1.8%.
Key Takeaways from CSG’s Q2 Results
We were impressed by CSG’s optimistic full-year revenue guidance, which blew past analysts’ expectations. We were also glad its revenue, EPS, and EBITDA outperformed Wall Street’s estimates. Zooming out, we think this was a solid print. The stock remained flat at $63.05 immediately after reporting.
CSG may have had a good quarter, but does that mean you should invest right now? If you’re making that decision, you should consider the bigger picture of valuation, business qualities, as well as the latest earnings. We cover that in our actionable full research report which you can read here, it’s free.