Fantasy sports and betting company DraftKings (NASDAQ: DKNG) announced better-than-expected revenue in Q2 CY2025, with sales up 36.9% year on year to $1.51 billion. The company expects the full year’s revenue to be around $6.3 billion, close to analysts’ estimates. Its non-GAAP profit of $0.38 per share was 6.3% below analysts’ consensus estimates.
Is now the time to buy DraftKings? Find out by accessing our full research report, it’s free.
DraftKings (DKNG) Q2 CY2025 Highlights:
- Revenue: $1.51 billion vs analyst estimates of $1.43 billion (36.9% year-on-year growth, 5.9% beat)
- Adjusted EPS: $0.38 vs analyst expectations of $0.41 (6.3% miss)
- Adjusted EBITDA: $300.6 million vs analyst estimates of $243.6 million (19.9% margin, 23.4% beat)
- The company reconfirmed its revenue guidance for the full year of $6.3 billion at the midpoint
- EBITDA guidance for the full year is $850 million at the midpoint, above analyst estimates of $840.8 million
- Operating Margin: 10%, up from -2.9% in the same quarter last year
- Free Cash Flow Margin: 7.2%, up from 2.4% in the same quarter last year
- Monthly Unique Payers: 3.3 million, up 200,000 year on year
- Market Capitalization: $22.51 billion
“We set records for revenue, net income and Adjusted EBITDA in the second quarter, driven by an acceleration in revenue growth to 37% year-over-year,” said Jason Robins, DraftKings’ Chief Executive Officer and Co-founder.
Company Overview
Getting its start in daily fantasy sports, DraftKings (NASDAQ: DKNG) is a digital sports entertainment and gaming company.
Revenue Growth
A company’s long-term performance is an indicator of its overall quality. Any business can put up a good quarter or two, but the best consistently grow over the long haul. Luckily, DraftKings’s sales grew at an incredible 64.9% compounded annual growth rate over the last five years. Its growth beat the average consumer discretionary company and shows its offerings resonate with customers, a helpful starting point for our analysis.
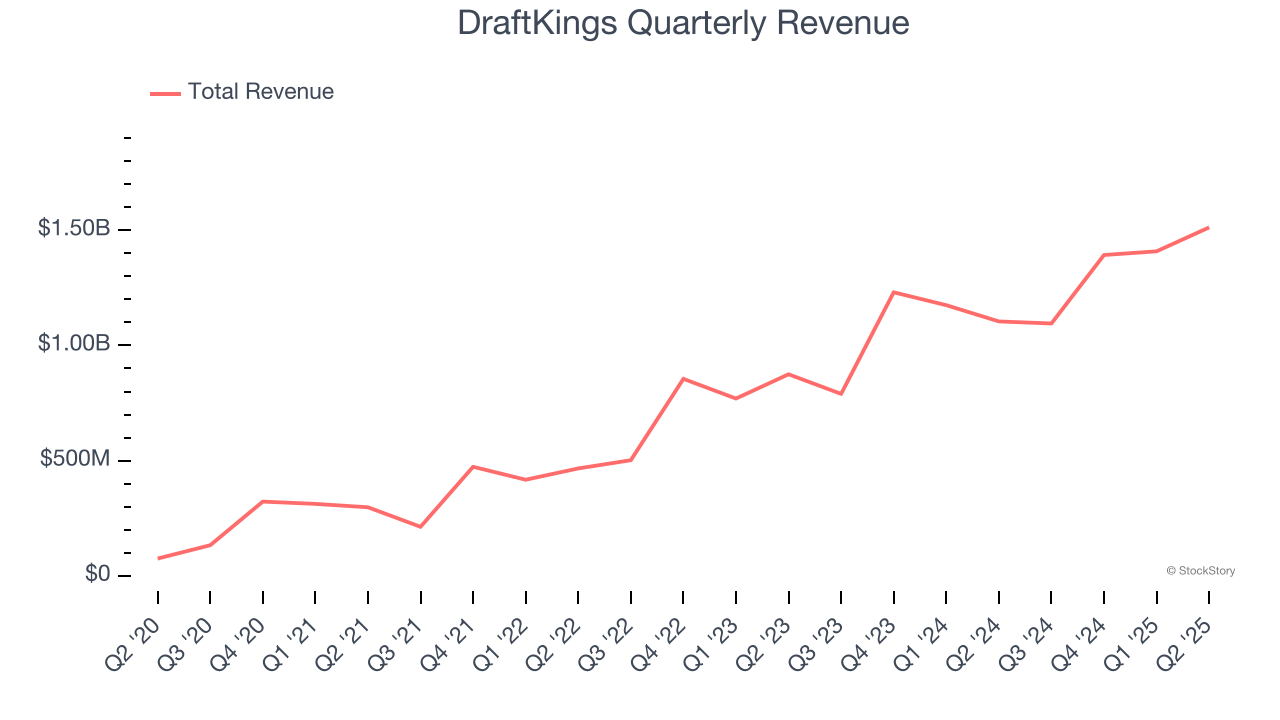
Long-term growth is the most important, but within consumer discretionary, product cycles are short and revenue can be hit-driven due to rapidly changing trends and consumer preferences. DraftKings’s annualized revenue growth of 34.2% over the last two years is below its five-year trend, but we still think the results suggest healthy demand. 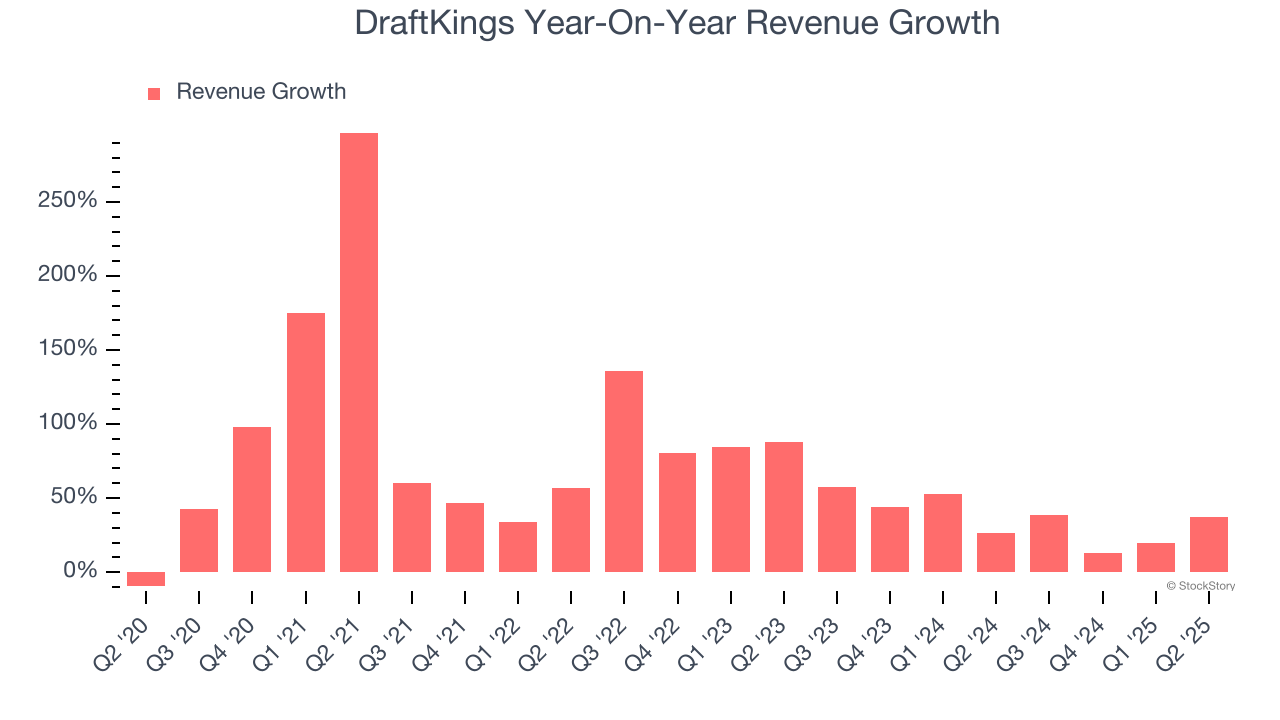
This quarter, DraftKings reported wonderful year-on-year revenue growth of 36.9%, and its $1.51 billion of revenue exceeded Wall Street’s estimates by 5.9%.
Looking ahead, sell-side analysts expect revenue to grow 27.3% over the next 12 months, a deceleration versus the last two years. Despite the slowdown, this projection is healthy and suggests the market is forecasting success for its products and services.
Here at StockStory, we certainly understand the potential of thematic investing. Diverse winners from Microsoft (MSFT) to Alphabet (GOOG), Coca-Cola (KO) to Monster Beverage (MNST) could all have been identified as promising growth stories with a megatrend driving the growth. So, in that spirit, we’ve identified a relatively under-the-radar profitable growth stock benefiting from the rise of AI, available to you FREE via this link.
Operating Margin
DraftKings’s operating margin has risen over the last 12 months, but it still averaged negative 8.6% over the last two years. This is due to its large expense base and inefficient cost structure. It might have a shot at long-term profitability if it can scale quickly and gain operating leverage.
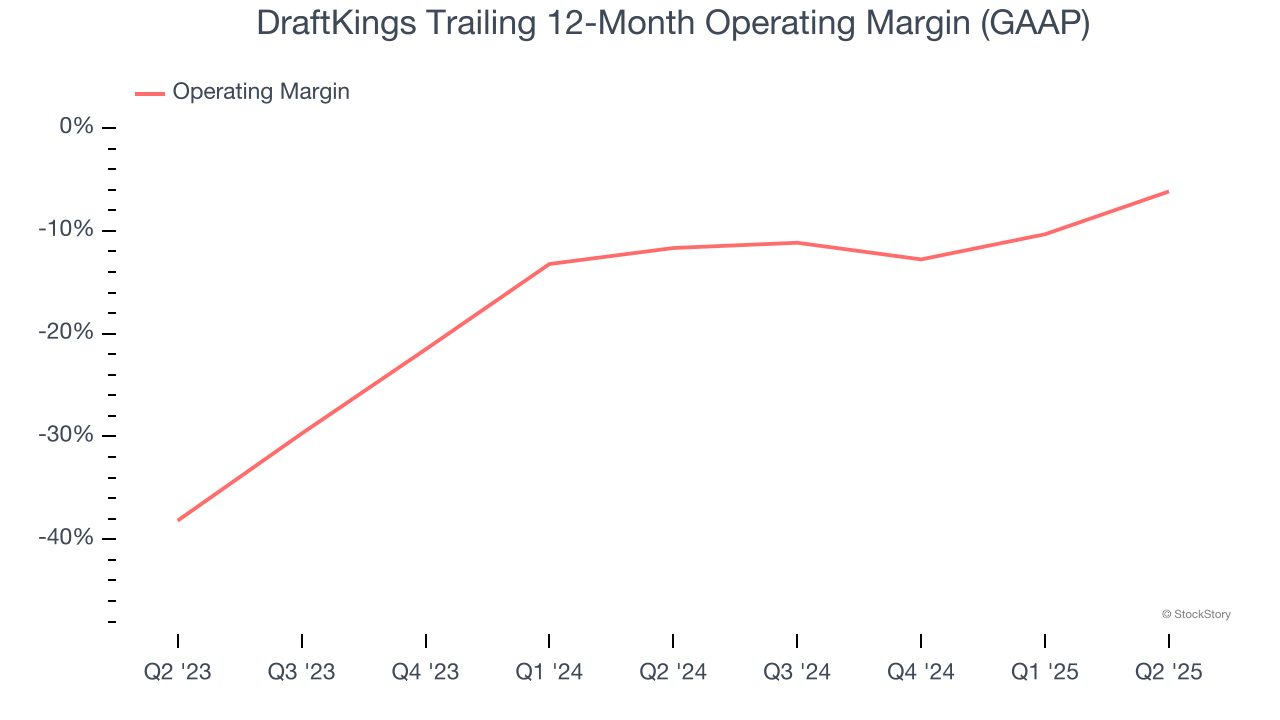
In Q2, DraftKings generated an operating margin profit margin of 10%, up 12.9 percentage points year on year. This increase was a welcome development and shows it was more efficient.
Earnings Per Share
We track the long-term change in earnings per share (EPS) for the same reason as long-term revenue growth. Compared to revenue, however, EPS highlights whether a company’s growth is profitable.
DraftKings’s full-year EPS flipped from negative to positive over the last five years. This is a good sign and shows it’s at an inflection point.
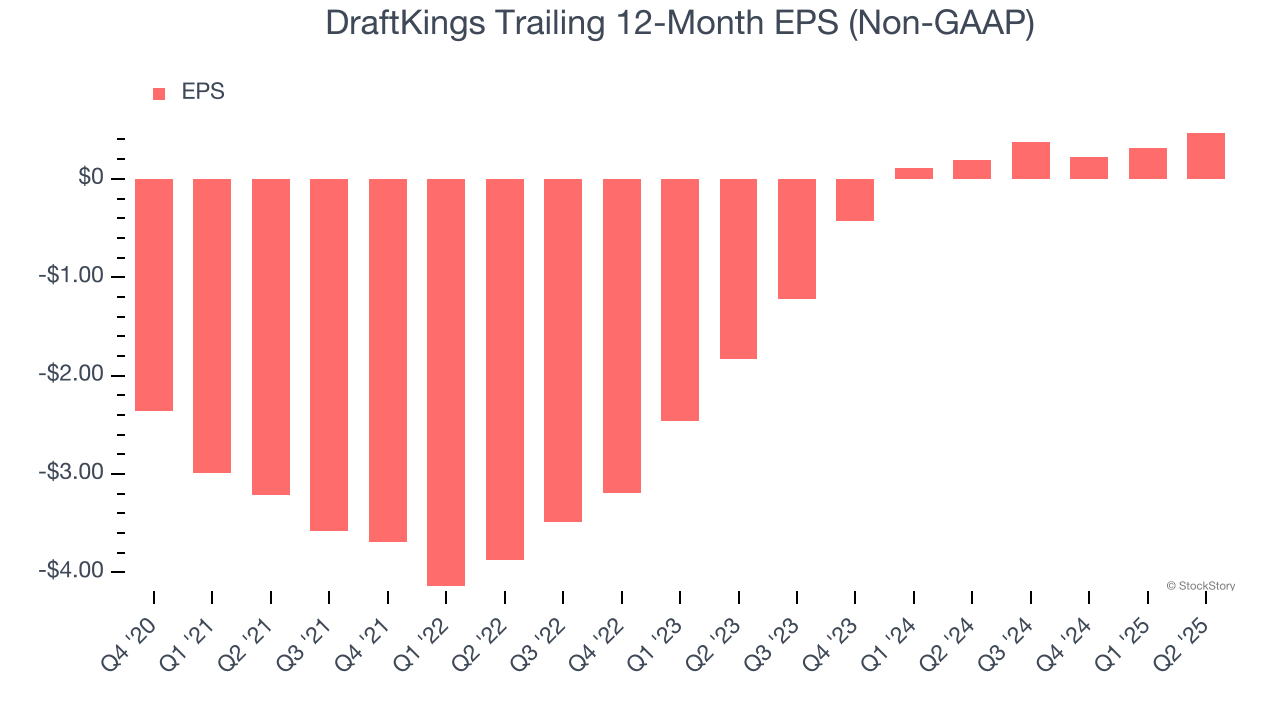
In Q2, DraftKings reported adjusted EPS at $0.38, up from $0.22 in the same quarter last year. Despite growing year on year, this print missed analysts’ estimates, but we care more about long-term adjusted EPS growth than short-term movements. We also like to analyze expected EPS growth based on Wall Street analysts’ consensus projections, but there is insufficient data.
Key Takeaways from DraftKings’s Q2 Results
We enjoyed seeing DraftKings beat analysts’ EBITDA expectations this quarter. We were also glad its revenue outperformed Wall Street’s estimates. On the other hand, its EPS missed. Overall, this print had some key positives. The stock traded up 5.3% to $47.80 immediately following the results.
So do we think DraftKings is an attractive buy at the current price? We think that the latest quarter is only one piece of the longer-term business quality puzzle. Quality, when combined with valuation, can help determine if the stock is a buy. We cover that in our actionable full research report which you can read here, it’s free.