Private corrections company GEO Group (NYSE: GEO) reported Q2 CY2025 results exceeding the market’s revenue expectations, with sales up 4.8% year on year to $636.2 million. On the other hand, next quarter’s revenue guidance of $655 million was less impressive, coming in 2.2% below analysts’ estimates. Its GAAP profit of $0.21 per share was 29.6% above analysts’ consensus estimates.
Is now the time to buy GEO Group? Find out by accessing our full research report, it’s free.
GEO Group (GEO) Q2 CY2025 Highlights:
- Revenue: $636.2 million vs analyst estimates of $623.4 million (4.8% year-on-year growth, 2% beat)
- EPS (GAAP): $0.21 vs analyst estimates of $0.16 (29.6% beat)
- Adjusted EBITDA: $118.6 million vs analyst estimates of $111 million (18.6% margin, 6.9% beat)
- The company lifted its revenue guidance for the full year to $2.56 million at the midpoint from $2.53 million, a 1.2% increase
- EPS (GAAP) guidance for the full year is $0.89 at the midpoint, missing analyst estimates by 4.1%
- EBITDA guidance for the full year is $477.5 million at the midpoint, below analyst estimates of $486.3 million
- Operating Margin: 11.3%, down from 13.2% in the same quarter last year
- Market Capitalization: $3.58 billion
George C. Zoley, Executive Chairman of GEO, said, “We are very pleased with our strong second quarter results, and the significant progress we have made towards meeting our growth and strategic objectives. All our efforts are aimed at placing GEO in the best competitive position possible to pursue what we believe to be unprecedented growth opportunities. Given the intrinsic value of our owned real estate assets, as evidenced by the recent $312 million sale of our Lawon, Oklahoma Facility, and the unprecedented growth opportunities in front of us, we believe strongly that our current equity valuation offers an attractive opportunity for investors. To capitalize on this unique opportunity to enhance long-term shareholder value, our Board of Directors has authorized a $300 million share repurchase program. Our focus as a management team remains on enhancing value for our shareholders through the disciplined allocation of capital.”
Company Overview
With a global footprint spanning three continents and approximately 81,000 beds across 100 facilities, GEO Group (NYSE: GEO) operates secure facilities, processing centers, and reentry services for government agencies in the United States, Australia, and South Africa.
Revenue Growth
Examining a company’s long-term performance can provide clues about its quality. Any business can put up a good quarter or two, but many enduring ones grow for years.
With $2.45 billion in revenue over the past 12 months, GEO Group is a mid-sized business services company, which sometimes brings disadvantages compared to larger competitors benefiting from better economies of scale.
As you can see below, GEO Group struggled to increase demand as its $2.45 billion of sales for the trailing 12 months was close to its revenue five years ago. This shows demand was soft, a poor baseline for our analysis.
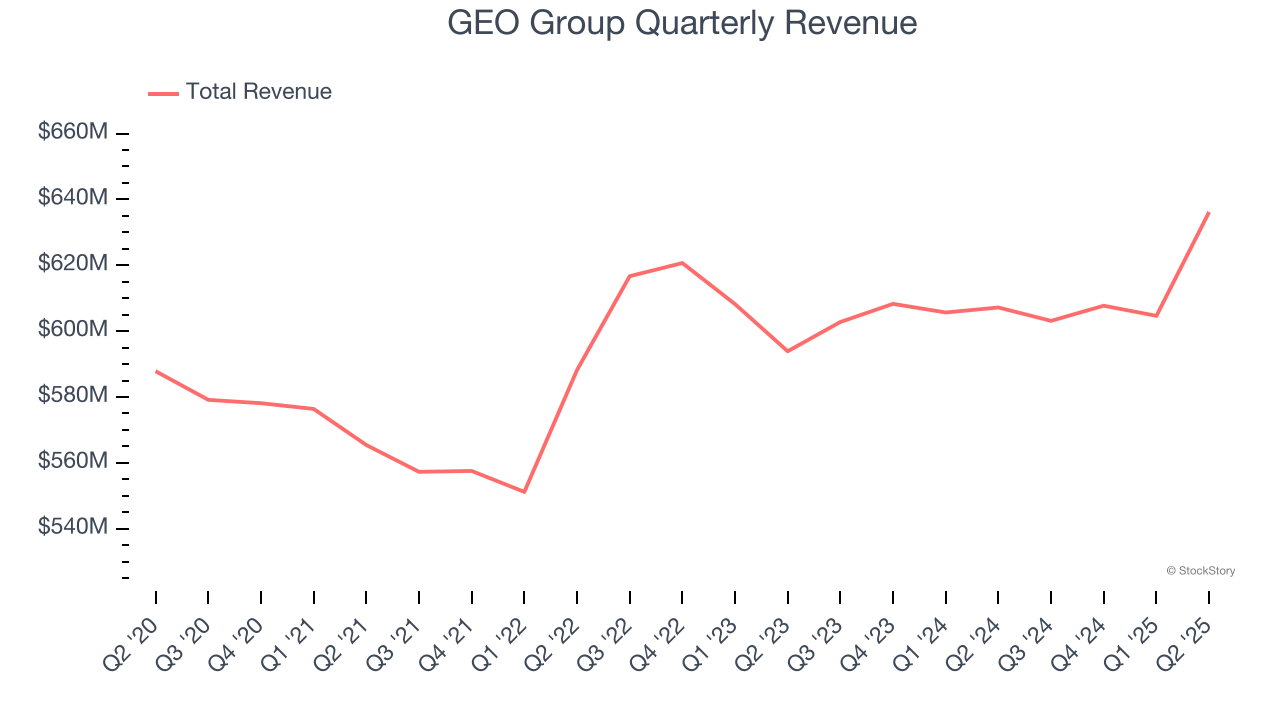
Long-term growth is the most important, but within business services, a half-decade historical view may miss new innovations or demand cycles. Just like its five-year trend, GEO Group’s revenue over the last two years was flat, suggesting it is in a slump. 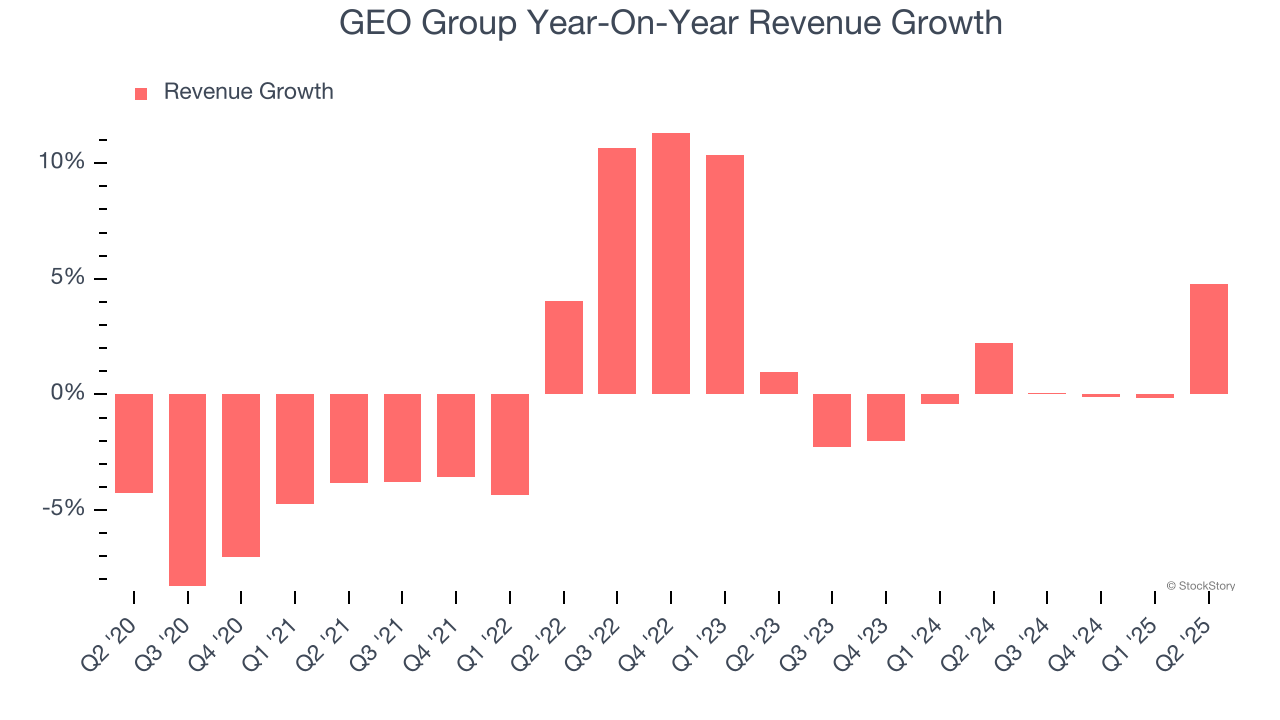
This quarter, GEO Group reported modest year-on-year revenue growth of 4.8% but beat Wall Street’s estimates by 2%. Company management is currently guiding for a 8.6% year-on-year increase in sales next quarter.
Looking further ahead, sell-side analysts expect revenue to grow 24.2% over the next 12 months, an improvement versus the last two years. This projection is eye-popping and indicates its newer products and services will spur better top-line performance.
Software is eating the world and there is virtually no industry left that has been untouched by it. That drives increasing demand for tools helping software developers do their jobs, whether it be monitoring critical cloud infrastructure, integrating audio and video functionality, or ensuring smooth content streaming. Click here to access a free report on our 3 favorite stocks to play this generational megatrend.
Operating Margin
GEO Group’s operating margin might fluctuated slightly over the last 12 months but has generally stayed the same, averaging 13.5% over the last five years. This profitability was solid for a business services business and shows it’s an efficient company that manages its expenses well.
Looking at the trend in its profitability, GEO Group’s operating margin might fluctuated slightly but has generally stayed the same over the last five years, highlighting the consistency of its expense base.
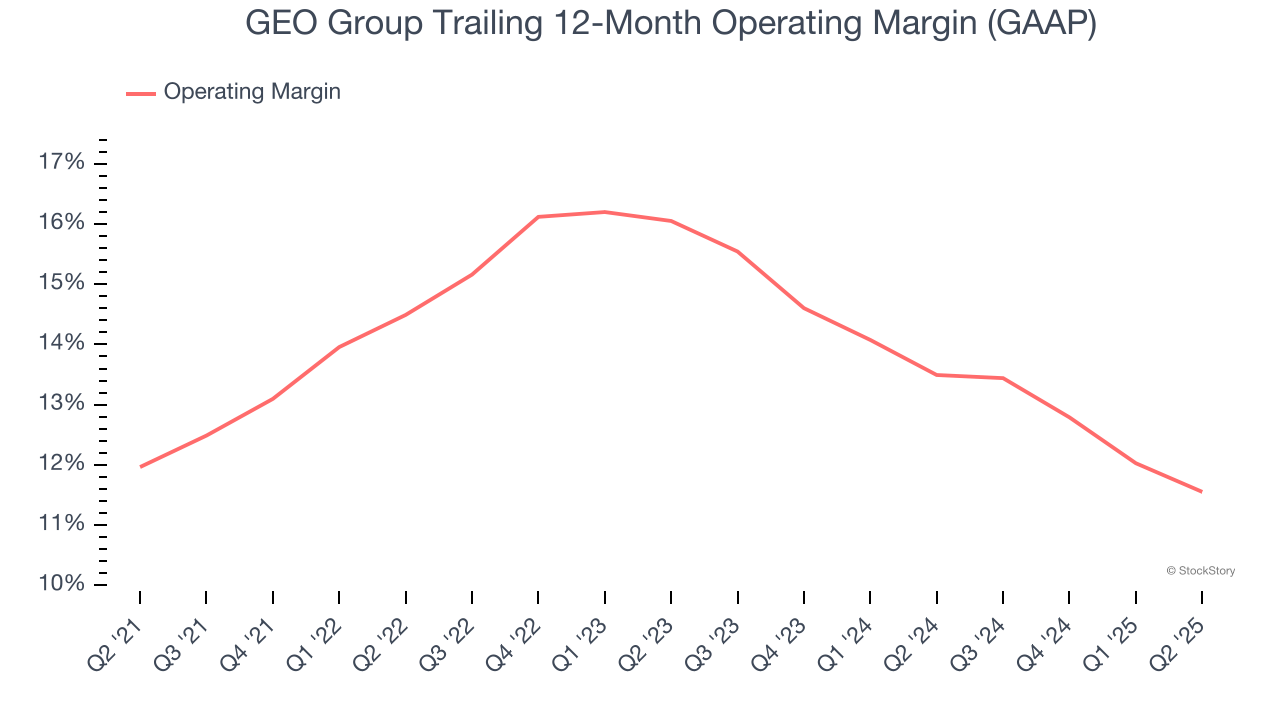
This quarter, GEO Group generated an operating margin profit margin of 11.3%, down 1.9 percentage points year on year. This reduction is quite minuscule and indicates the company’s overall cost structure has been relatively stable.
Earnings Per Share
Revenue trends explain a company’s historical growth, but the long-term change in earnings per share (EPS) points to the profitability of that growth – for example, a company could inflate its sales through excessive spending on advertising and promotions.
Sadly for GEO Group, its EPS declined by 12% annually over the last five years while its revenue was flat. This tells us the company struggled because its fixed cost base made it difficult to adjust to choppy demand.
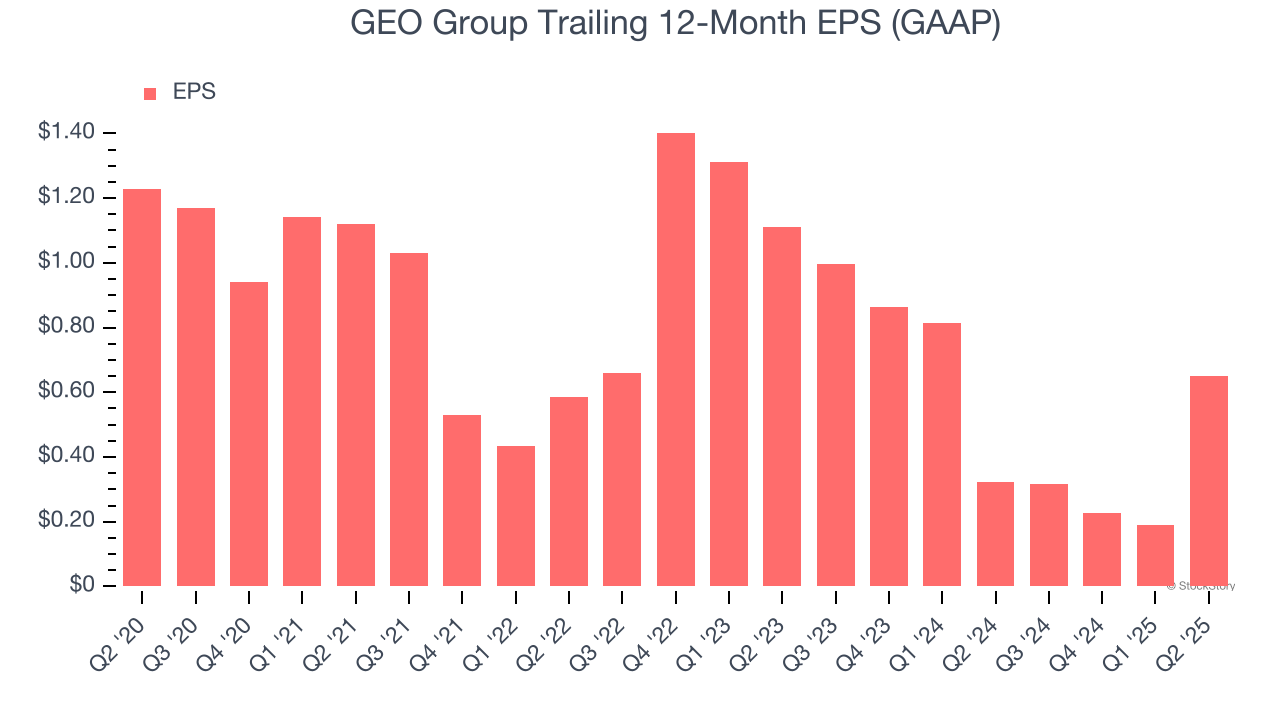
Like with revenue, we analyze EPS over a shorter period to see if we are missing a change in the business.
For GEO Group, its two-year annual EPS declines of 23.5% show it’s continued to underperform. These results were bad no matter how you slice the data.
In Q2, GEO Group reported EPS at $0.21, up from negative $0.25 in the same quarter last year. This print easily cleared analysts’ estimates, and shareholders should be content with the results. Over the next 12 months, Wall Street expects GEO Group’s full-year EPS of $0.65 to grow 190%.
Key Takeaways from GEO Group’s Q2 Results
We liked that GEO Group beat analysts’ revenue and EPS expectations this quarter. While the company lifted full-year revenue guidance, it still came in below expectations. Overall, this was still a solid quarter. The stock traded up 4.5% to $27 immediately after reporting.
Should you buy the stock or not? If you’re making that decision, you should consider the bigger picture of valuation, business qualities, as well as the latest earnings. We cover that in our actionable full research report which you can read here, it’s free.