Optical retailer National Vision (NYSE: EYE) reported Q2 CY2025 results topping the market’s revenue expectations, with sales up 7.7% year on year to $486.4 million. The company’s full-year revenue guidance of $1.95 billion at the midpoint came in 0.7% above analysts’ estimates. Its non-GAAP profit of $0.18 per share was 31.1% above analysts’ consensus estimates.
Is now the time to buy National Vision? Find out by accessing our full research report, it’s free.
National Vision (EYE) Q2 CY2025 Highlights:
- Revenue: $486.4 million vs analyst estimates of $469.8 million (7.7% year-on-year growth, 3.5% beat)
- Adjusted EPS: $0.18 vs analyst estimates of $0.14 (31.1% beat)
- Adjusted EBITDA: $46.17 million vs analyst estimates of $40.73 million (9.5% margin, 13.4% beat)
- The company slightly lifted its revenue guidance for the full year to $1.95 billion at the midpoint from $1.94 billion
- Management raised its full-year Adjusted EPS guidance to $0.66 at the midpoint, a 4.8% increase
- Operating Margin: 3.4%, up from 0.1% in the same quarter last year
- Free Cash Flow Margin: 8.7%, up from 7.1% in the same quarter last year
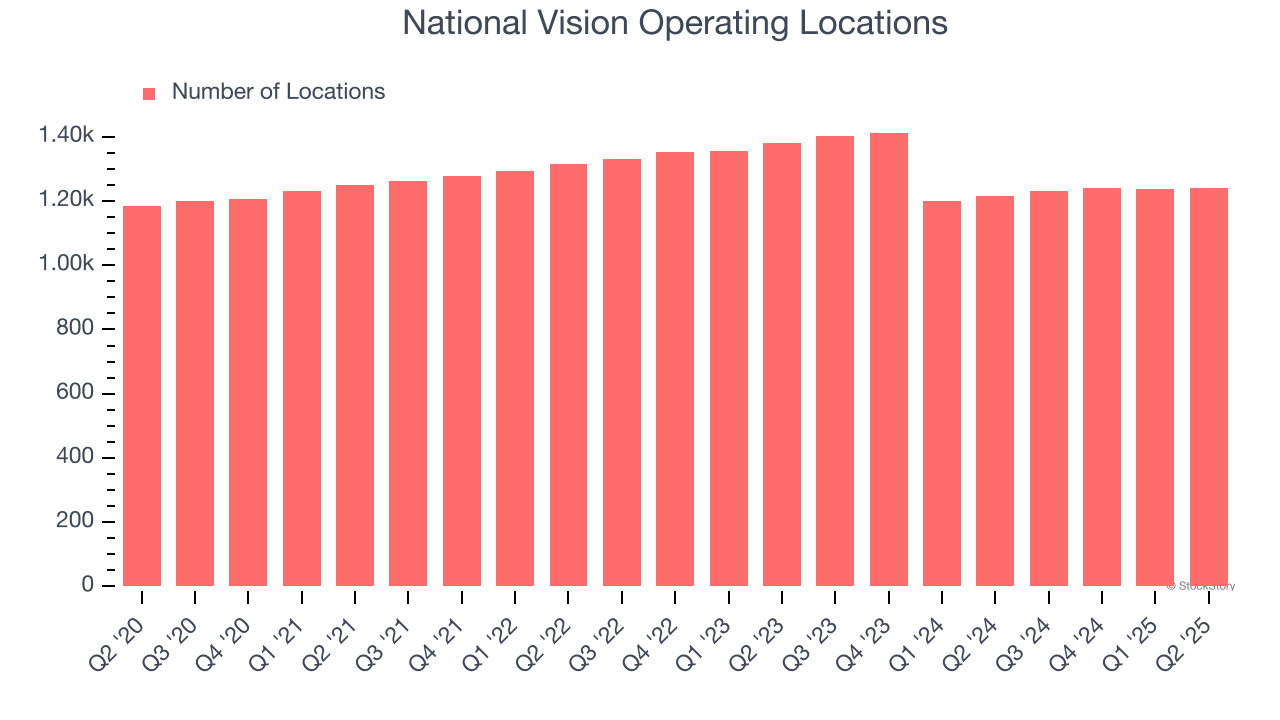
- Locations: 1,240 at quarter end, up from 1,216 in the same quarter last year
- Same-Store Sales rose 6.5% year on year (2.4% in the same quarter last year)
- Market Capitalization: $1.96 billion
“Our strong performance this quarter reflects the continued successful execution of our transformation program and the dedicated efforts of our entire National Vision team,” said Alex Wilkes, National Vision’s CEO.
Company Overview
Operating under multiple brands, National Vision (NYSE: EYE) sells optical products such as eyeglasses and provides optical services such as eye exams.
Revenue Growth
Examining a company’s long-term performance can provide clues about its quality. Any business can experience short-term success, but top-performing ones enjoy sustained growth for years.
With $1.89 billion in revenue over the past 12 months, National Vision is a small retailer, which sometimes brings disadvantages compared to larger competitors benefiting from economies of scale and negotiating leverage with suppliers.
As you can see below, National Vision’s 2.4% annualized revenue growth over the last six years (we compare to 2019 to normalize for COVID-19 impacts) was sluggish as it closed stores.
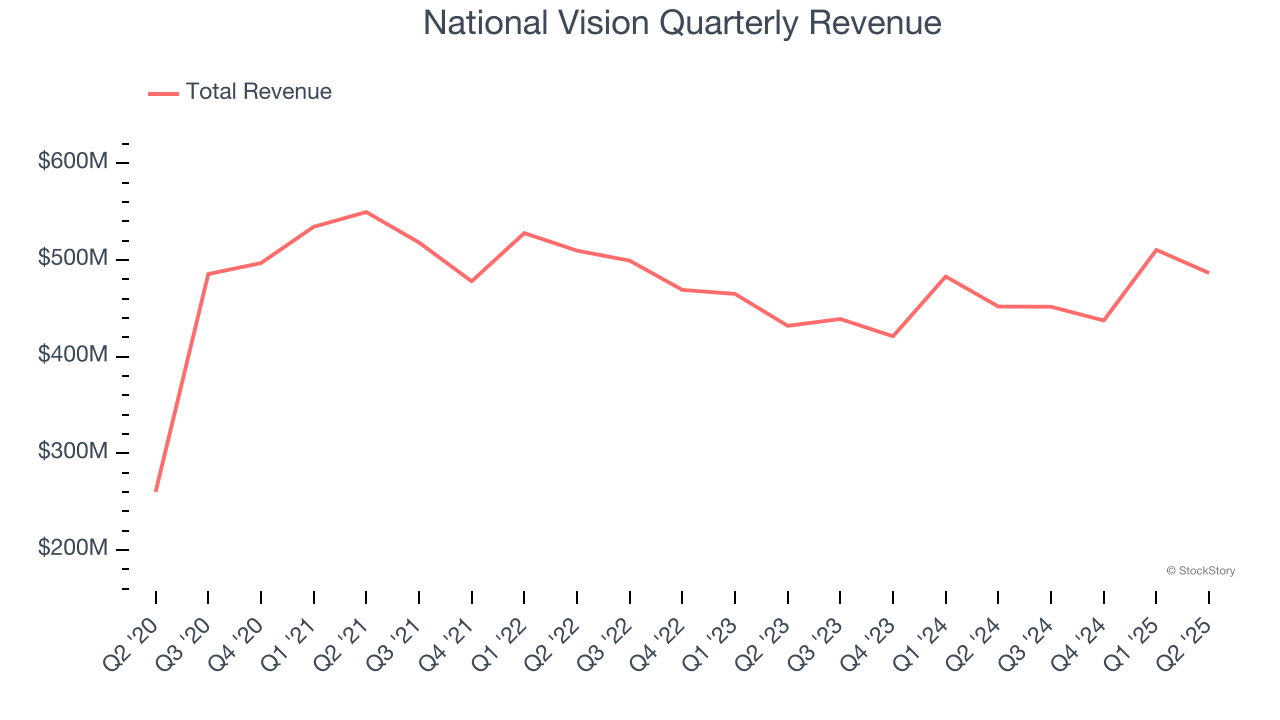
This quarter, National Vision reported year-on-year revenue growth of 7.7%, and its $486.4 million of revenue exceeded Wall Street’s estimates by 3.5%.
Looking ahead, sell-side analysts expect revenue to grow 5.3% over the next 12 months, an acceleration versus the last six years. This projection is healthy and suggests its newer products will spur better top-line performance.
Here at StockStory, we certainly understand the potential of thematic investing. Diverse winners from Microsoft (MSFT) to Alphabet (GOOG), Coca-Cola (KO) to Monster Beverage (MNST) could all have been identified as promising growth stories with a megatrend driving the growth. So, in that spirit, we’ve identified a relatively under-the-radar profitable growth stock benefiting from the rise of AI, available to you FREE via this link.
Store Performance
Number of Stores
National Vision operated 1,240 locations in the latest quarter. Over the last two years, the company has generally closed its stores, averaging 4.2% annual declines.
When a retailer shutters stores, it usually means that brick-and-mortar demand is less than supply, and it is responding by closing underperforming locations to improve profitability.
Same-Store Sales
The change in a company's store base only tells one side of the story. The other is the performance of its existing locations and e-commerce sales, which informs management teams whether they should expand or downsize their physical footprints. Same-store sales gives us insight into this topic because it measures organic growth for a retailer's e-commerce platform and brick-and-mortar shops that have existed for at least a year.
National Vision’s demand has been spectacular for a retailer over the last two years. On average, the company has increased its same-store sales by an impressive 3.5% per year. Given its declining store base over the same period, this performance stems from a mixture of higher e-commerce sales and increased foot traffic at existing locations (closing stores can sometimes boost same-store sales).
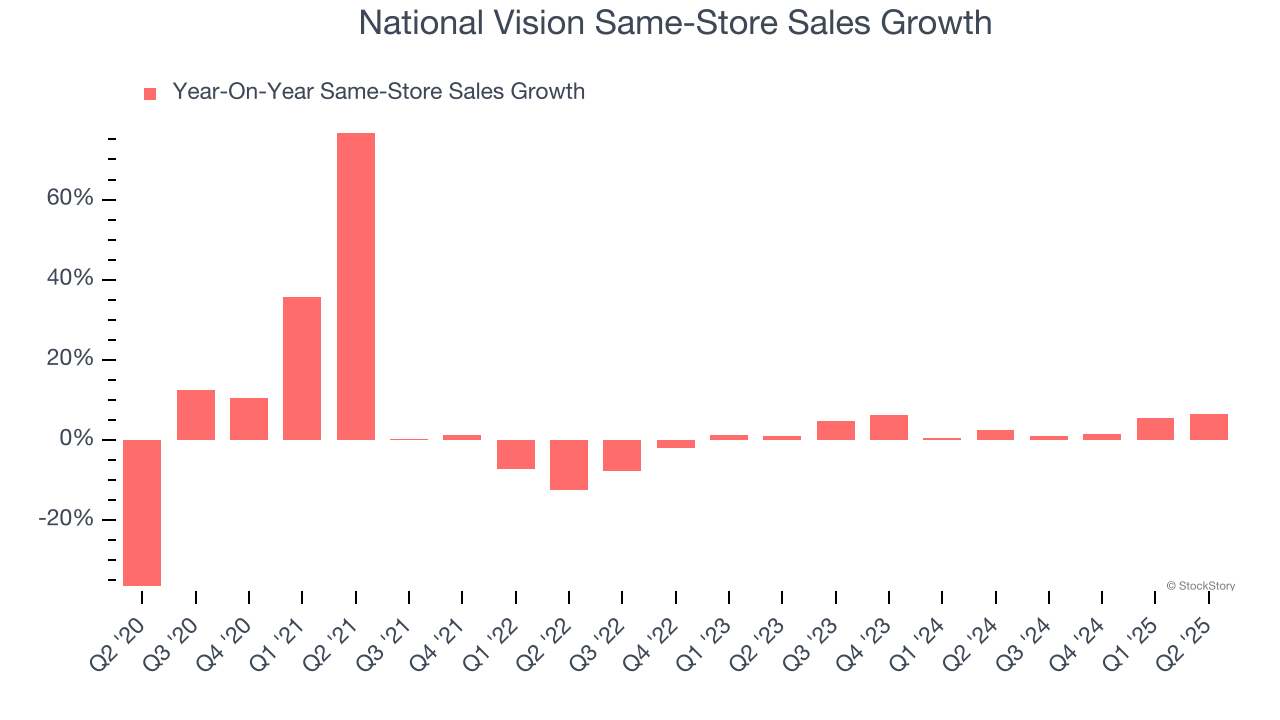
In the latest quarter, National Vision’s same-store sales rose 6.5% year on year. This growth was an acceleration from its historical levels, which is always an encouraging sign.
Key Takeaways from National Vision’s Q2 Results
We were impressed by how significantly National Vision blew past analysts’ EBITDA and EPS expectations this quarter. We were also excited that the company raised full-year guidance, another signal of positive business momentum. Zooming out, we think this was a solid print. The stock traded up 9.9% to $27.29 immediately after reporting.
National Vision put up rock-solid earnings, but one quarter doesn’t necessarily make the stock a buy. Let’s see if this is a good investment. The latest quarter does matter, but not nearly as much as longer-term fundamentals and valuation, when deciding if the stock is a buy. We cover that in our actionable full research report which you can read here, it’s free.