
Digital auto insurance company Root (NASDAQ: ROOT) reported Q2 CY2025 results beating Wall Street’s revenue expectations, with sales up 32.4% year on year to $382.9 million. Its GAAP profit of $1.29 per share was 89.4% above analysts’ consensus estimates.
Is now the time to buy Root? Find out by accessing our full research report, it’s free.
Root (ROOT) Q2 CY2025 Highlights:
- Net Premiums Earned: $353 million vs analyst estimates of $300.5 million (34.9% year-on-year growth, 17.5% beat)
- Revenue: $382.9 million vs analyst estimates of $356.1 million (32.4% year-on-year growth, 7.5% beat)
- Combined Ratio: 95.2% vs analyst estimates of 102% (6.3 percentage point beat)
- EPS (GAAP): $1.29 vs analyst estimates of $0.68 (89.4% beat)
- Market Capitalization: $1.88 billion
Company Overview
Pioneering a data-driven approach that rewards good driving habits, Root (NASDAQ: ROOT) is a technology-driven auto insurance company that uses mobile apps to acquire customers and data science to price policies based on individual driving behavior.
Revenue Growth
Insurance companies earn revenue from three primary sources:
- The core insurance business itself, often called underwriting and represented in the income statement as premiums
- Income from investing the “float” (premiums collected upfront not yet paid out as claims) in assets such as fixed-income assets and equities
- Fees from various sources such as policy administration, annuities, or other value-added services
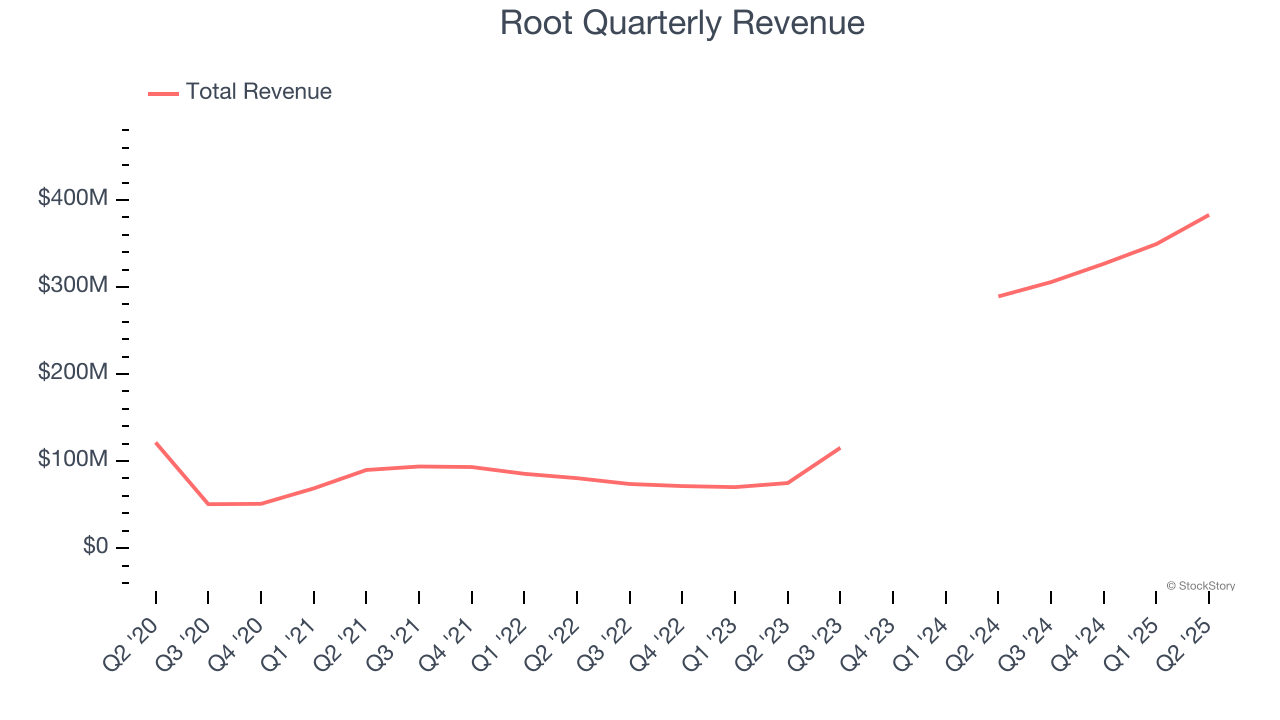
Luckily, Root’s revenue grew at an incredible 25.9% compounded annual growth rate over the last five years. Its growth beat the average insurance company and shows its offerings resonate with customers.
 Note: Quarters not shown were determined to be outliers, impacted by outsized investment gains/losses that are not indicative of the recurring fundamentals of the business.
Long-term growth is the most important, but within financials, a half-decade historical view may miss recent interest rate changes and market returns. Root’s annualized revenue growth of 117% over the last two years is above its five-year trend, suggesting its demand was strong and recently accelerated. 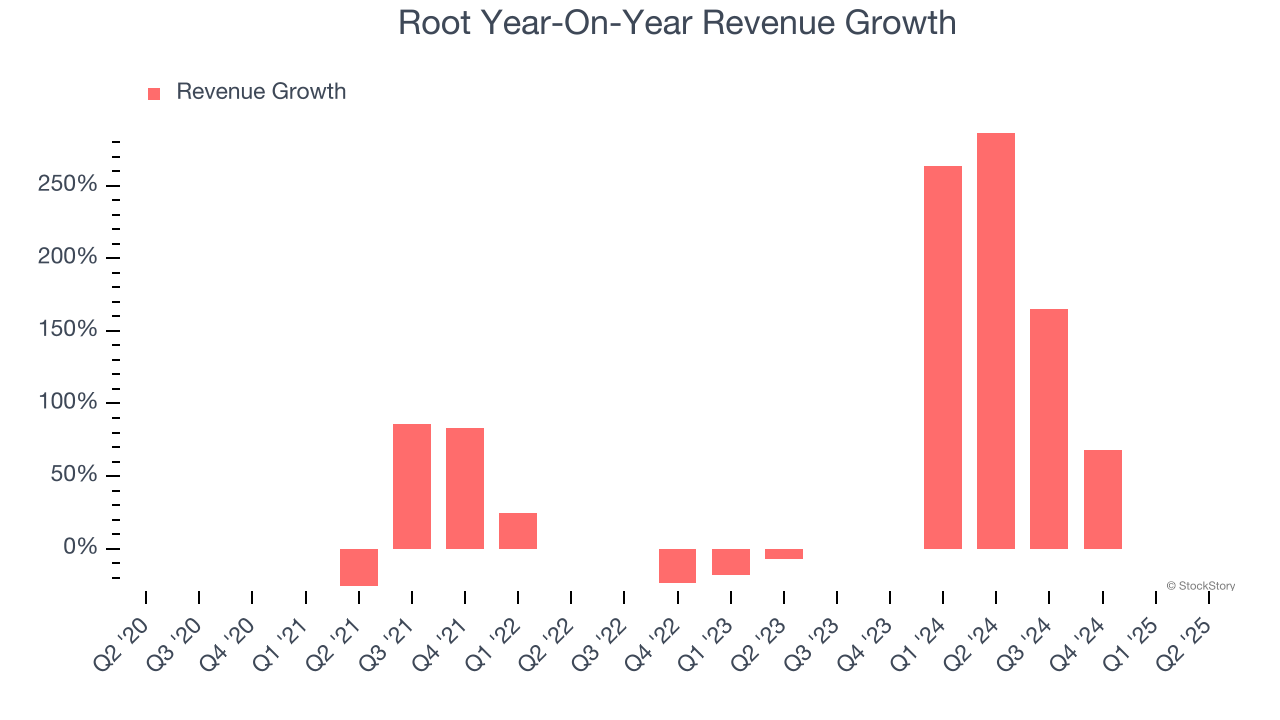 Note: Quarters not shown were determined to be outliers, impacted by outsized investment gains/losses that are not indicative of the recurring fundamentals of the business.
This quarter, Root reported wonderful year-on-year revenue growth of 32.4%, and its $382.9 million of revenue exceeded Wall Street’s estimates by 7.5%.
Net premiums earned made up 90.7% of the company’s total revenue during the last five years, meaning Root lives and dies by its underwriting activities because non-insurance operations barely move the needle.
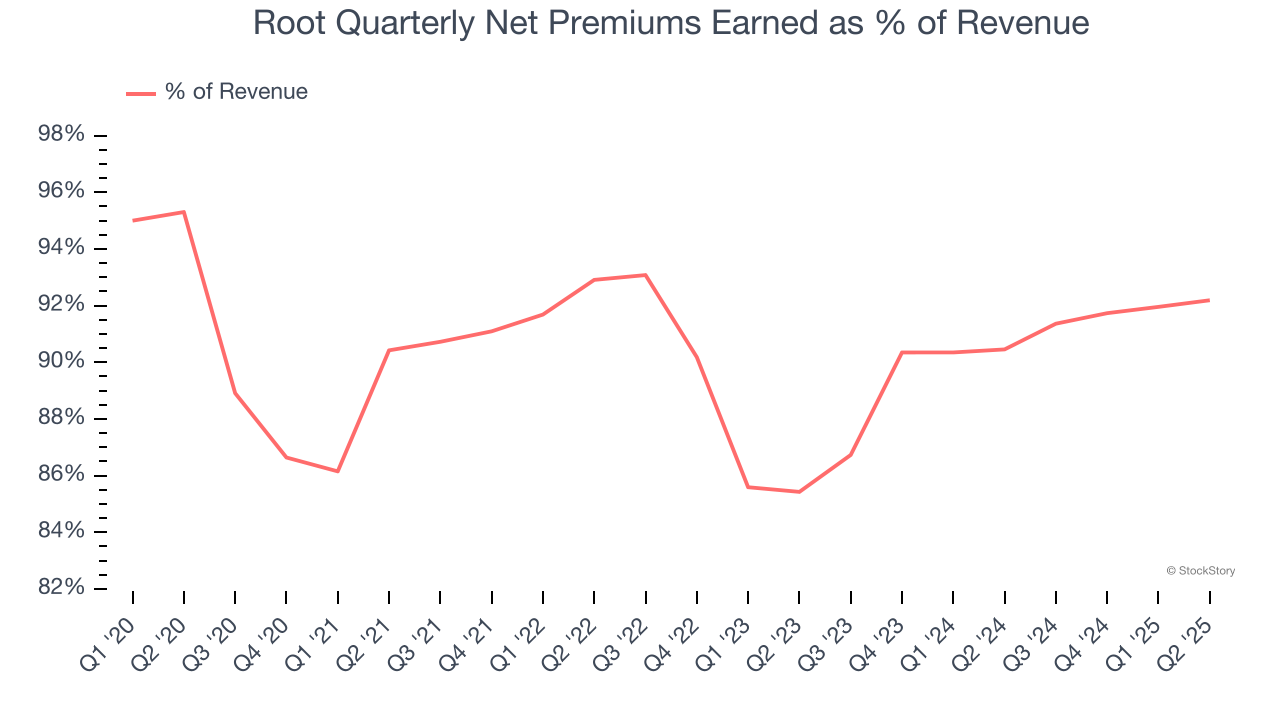
Net premiums earned commands greater market attention due to its reliability and consistency, whereas investment and fee income are often seen as more volatile revenue streams that fluctuate with market conditions.
Today’s young investors won’t have read the timeless lessons in Gorilla Game: Picking Winners In High Technology because it was written more than 20 years ago when Microsoft and Apple were first establishing their supremacy. But if we apply the same principles, then enterprise software stocks leveraging their own generative AI capabilities may well be the Gorillas of the future. So, in that spirit, we are excited to present our Special Free Report on a profitable, fast-growing enterprise software stock that is already riding the automation wave and looking to catch the generative AI next.
Net Premiums Earned
When insurers sell policies, they protect themselves from extremely large losses or an outsized accumulation of losses with reinsurance (insurance for insurance companies). Net premiums earned are therefore gross premiums less what’s ceded to reinsurers as a risk mitigation and transfer strategy.
Root’s net premiums earned has grown at a 23.6% annualized rate over the last five years, much better than the broader insurance industry but slower than its total revenue.
When analyzing Root’s net premiums earned over the last two years, we can see that growth accelerated to 121% annually. Since two-year net premiums earned grew faster than total revenue over this period, it's implied that other line items such as investment income grew at a slower rate. These extra revenue streams are important to the bottom line, yet their performance can be inconsistent. Some firms have been more successful and consistent in managing their float, but sharp fluctuations in the fixed income and equity markets can dramatically affect short-term results.
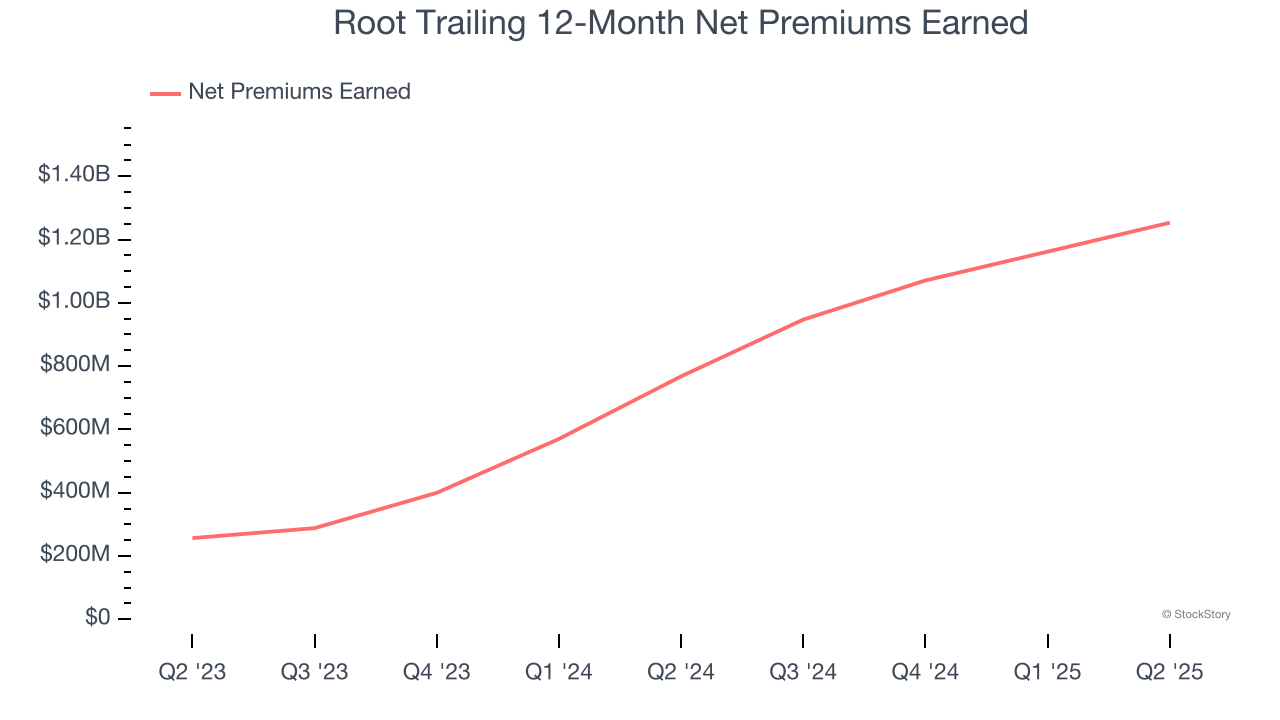
Root produced $353 million of net premiums earned in Q2, up a hearty 34.9% year on year and topping Wall Street Consensus estimates by 17.5%.
Key Takeaways from Root’s Q2 Results
We were impressed by how significantly Root blew past analysts’ EPS expectations this quarter. We were also excited its net premiums earned outperformed Wall Street’s estimates by a wide margin. Zooming out, we think this was a good print with some key areas of upside. The stock traded up 8% to $132.99 immediately after reporting.
Sure, Root had a solid quarter, but if we look at the bigger picture, is this stock a buy? We think that the latest quarter is only one piece of the longer-term business quality puzzle. Quality, when combined with valuation, can help determine if the stock is a buy. We cover that in our actionable full research report which you can read here, it’s free.