Golf entertainment and gear company Topgolf Callaway (NYSE: MODG) reported revenue ahead of Wall Street’s expectations in Q2 CY2025, but sales fell by 4.1% year on year to $1.11 billion. On the other hand, next quarter’s revenue guidance of $900 million was less impressive, coming in 4.3% below analysts’ estimates. Its non-GAAP profit of $0.24 per share was significantly above analysts’ consensus estimates.
Is now the time to buy Topgolf Callaway? Find out by accessing our full research report, it’s free.
Topgolf Callaway (MODG) Q2 CY2025 Highlights:
- Revenue: $1.11 billion vs analyst estimates of $1.09 billion (4.1% year-on-year decline, 1.7% beat)
- Adjusted EPS: $0.24 vs analyst estimates of $0.03 (significant beat)
- Adjusted EBITDA: $195.8 million vs analyst estimates of $147.2 million (17.6% margin, 33% beat)
- The company dropped its revenue guidance for the full year to $3.86 billion at the midpoint from $4.09 billion, a 5.7% decrease
- EBITDA guidance for the full year is $460 million at the midpoint, above analyst estimates of $437 million
- Operating Margin: 9.5%, in line with the same quarter last year
- Free Cash Flow Margin: 4.7%, down from 12.2% in the same quarter last year
- Market Capitalization: $1.62 billion
"We are pleased with our second quarter financial results as we met or beat expectations in all segments of our ongoing business and our consolidated revenue and Adjusted EBITDA surpassed our expectations going into the quarter," stated Chip Brewer, CEO of Topgolf Callaway Brands.
Company Overview
Formed between the merger of Callaway and Topgolf, Topgolf Callaway (NYSE: MODG) sells golf equipment and operates technology-driven golf entertainment venues.
Revenue Growth
Examining a company’s long-term performance can provide clues about its quality. Any business can have short-term success, but a top-tier one grows for years. Thankfully, Topgolf Callaway’s 22.9% annualized revenue growth over the last five years was impressive. Its growth beat the average consumer discretionary company and shows its offerings resonate with customers.
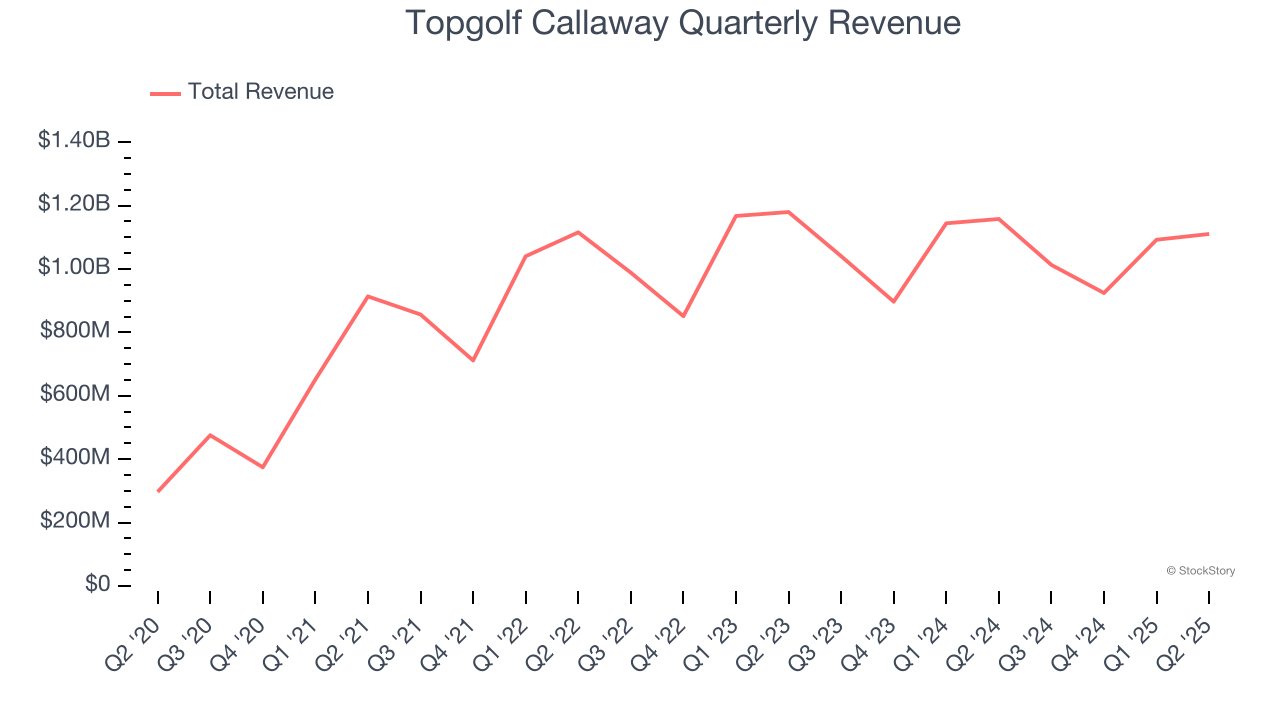
We at StockStory place the most emphasis on long-term growth, but within consumer discretionary, a stretched historical view may miss a company riding a successful new product or trend. Topgolf Callaway’s recent performance shows its demand has slowed significantly as its revenue was flat over the last two years. Note that COVID hurt Topgolf Callaway’s business in 2020 and part of 2021, and it bounced back in a big way thereafter. 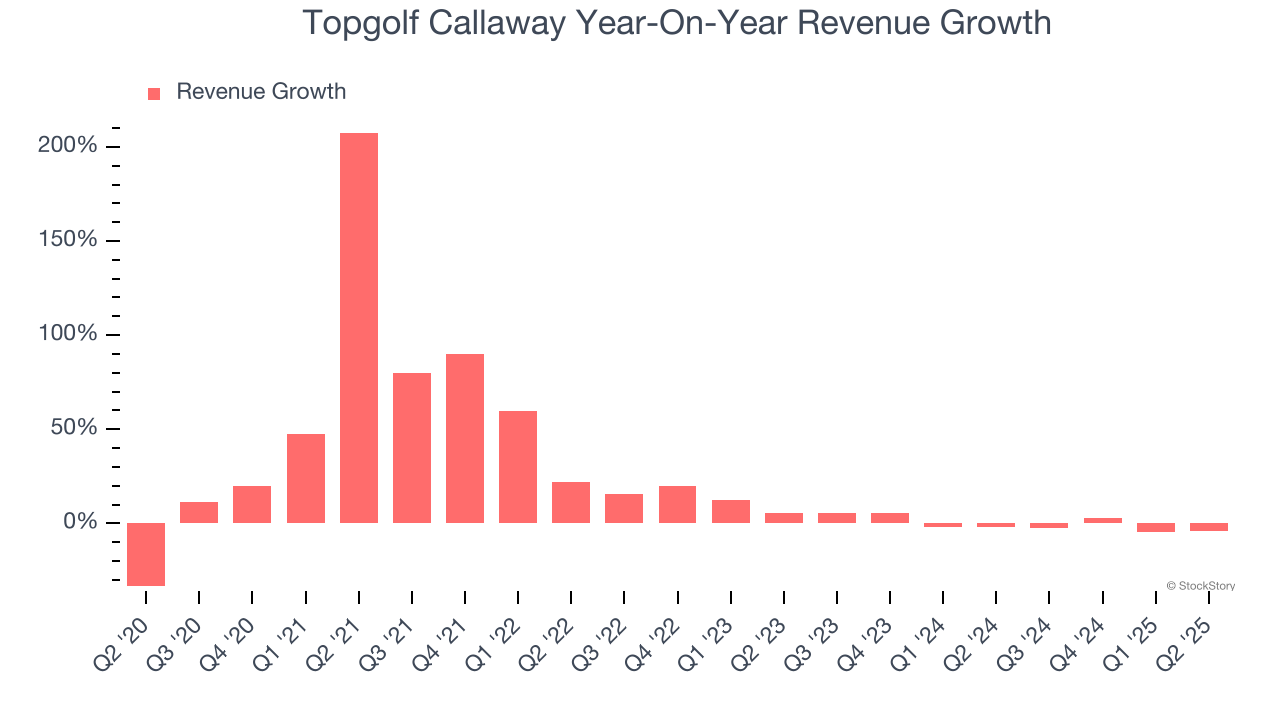
This quarter, Topgolf Callaway’s revenue fell by 4.1% year on year to $1.11 billion but beat Wall Street’s estimates by 1.7%. Company management is currently guiding for a 11.1% year-on-year decline in sales next quarter.
Looking further ahead, sell-side analysts expect revenue to decline by 3.4% over the next 12 months, a slight deceleration versus the last two years. This projection is underwhelming and implies its products and services will face some demand challenges.
Unless you’ve been living under a rock, it should be obvious by now that generative AI is going to have a huge impact on how large corporations do business. While Nvidia and AMD are trading close to all-time highs, we prefer a lesser-known (but still profitable) stock benefiting from the rise of AI. Click here to access our free report one of our favorites growth stories.
Operating Margin
Topgolf Callaway’s operating margin has been trending down over the last 12 months and averaged negative 12.5% over the last two years. Unprofitable, high-growth companies warrant extra scrutiny, especially if their margins fall because they’re spending loads of money to stay relevant, an unsustainable practice.
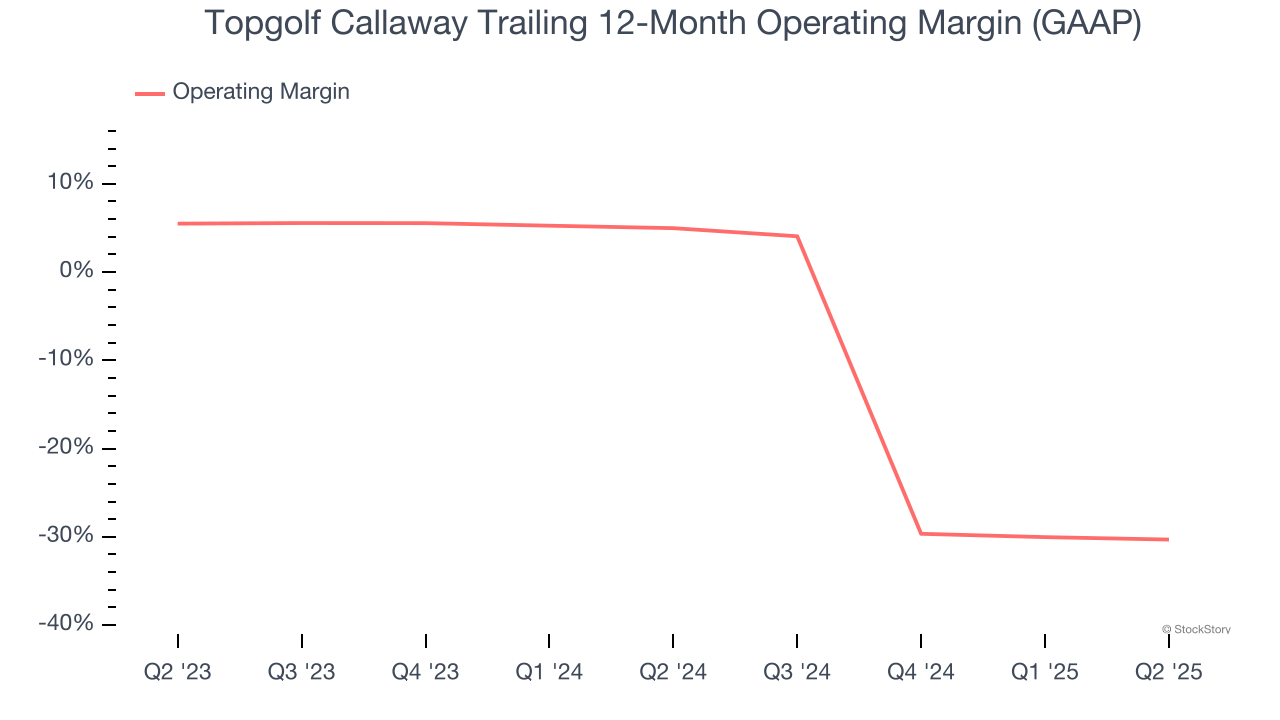
In Q2, Topgolf Callaway generated an operating margin profit margin of 9.5%, in line with the same quarter last year. This indicates the company’s overall cost structure has been relatively stable.
Earnings Per Share
Revenue trends explain a company’s historical growth, but the long-term change in earnings per share (EPS) points to the profitability of that growth – for example, a company could inflate its sales through excessive spending on advertising and promotions.
Sadly for Topgolf Callaway, its EPS declined by 39.2% annually over the last five years while its revenue grew by 22.9%. However, its operating margin actually improved during this time, telling us that non-fundamental factors such as interest expenses and taxes affected its ultimate earnings.
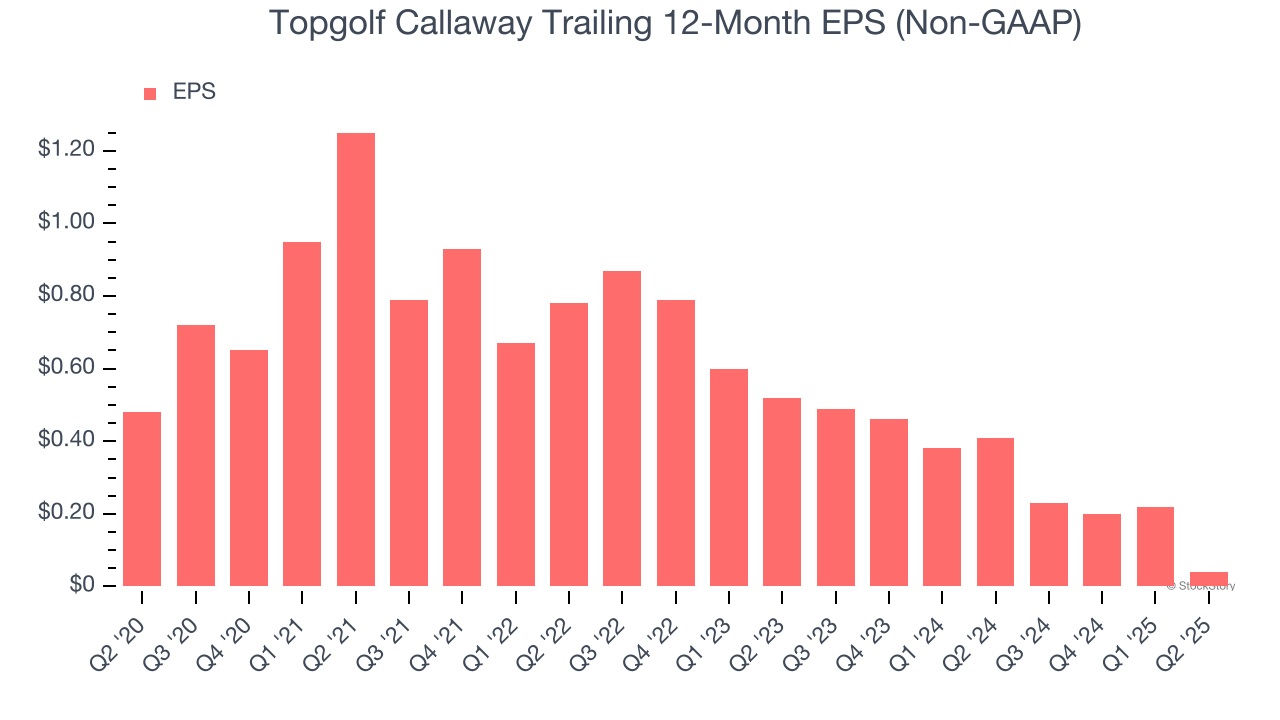
In Q2, Topgolf Callaway reported adjusted EPS at $0.24, down from $0.42 in the same quarter last year. Despite falling year on year, this print easily cleared analysts’ estimates. Over the next 12 months, Wall Street expects Topgolf Callaway to perform poorly. Analysts forecast its full-year EPS of $0.04 will hit negative $0.49.
Key Takeaways from Topgolf Callaway’s Q2 Results
We were impressed by Topgolf Callaway’s optimistic EBITDA guidance for next quarter, which blew past analysts’ expectations. We were also excited its EPS outperformed Wall Street’s estimates by a wide margin. On the other hand, its revenue guidance for next quarter missed and its Topgolf revenue fell short of Wall Street’s estimates this quarter. Overall, we think this was a mixed quarter. The stock remained flat at $8.79 immediately after reporting.
Is Topgolf Callaway an attractive investment opportunity at the current price? If you’re making that decision, you should consider the bigger picture of valuation, business qualities, as well as the latest earnings. We cover that in our actionable full research report which you can read here, it’s free.