Website design and e-commerce platform provider Wix.com (NASDAQ: WIX) announced better-than-expected revenue in Q2 CY2025, with sales up 12.4% year on year to $489.9 million. The company expects next quarter’s revenue to be around $501 million, close to analysts’ estimates. Its non-GAAP profit of $2.28 per share was 29.7% above analysts’ consensus estimates.
Is now the time to buy Wix? Find out by accessing our full research report, it’s free.
Wix (WIX) Q2 CY2025 Highlights:
- Revenue: $489.9 million vs analyst estimates of $487.1 million (12.4% year-on-year growth, 0.6% beat)
- Adjusted EPS: $2.28 vs analyst estimates of $1.76 (29.7% beat)
- Adjusted Operating Income: $110.2 million vs analyst estimates of $108.7 million (22.5% margin, 1.4% beat)
- The company slightly lifted its revenue guidance for the full year to $1.99 billion at the midpoint from $1.99 billion
- Operating Margin: 9%, up from 6.6% in the same quarter last year
- Free Cash Flow Margin: 30.1%, similar to the previous quarter
- Market Capitalization: $7.16 billion
“Demand for AI-powered online creation continues to accelerate, and Wix is leading the way as more people use our platform to build sophisticated, high-quality projects with greater speed and ease. This ongoing momentum drove our new cohort bookings to their highest levels since peak-COVID, setting the stage for continued growth in the second half of the year and beyond,” said Avishai Abrahami, Co-founder and CEO at Wix.
Company Overview
Founded in 2006 in Tel Aviv, Wix.com (NASDAQ: WIX) offers a free and easy to operate website building platform.
Revenue Growth
Reviewing a company’s long-term sales performance reveals insights into its quality. Any business can have short-term success, but a top-tier one grows for years. Over the last three years, Wix grew its sales at a 11.7% compounded annual growth rate. Although this growth is acceptable on an absolute basis, it fell short of our standards for the software sector, which enjoys a number of secular tailwinds.
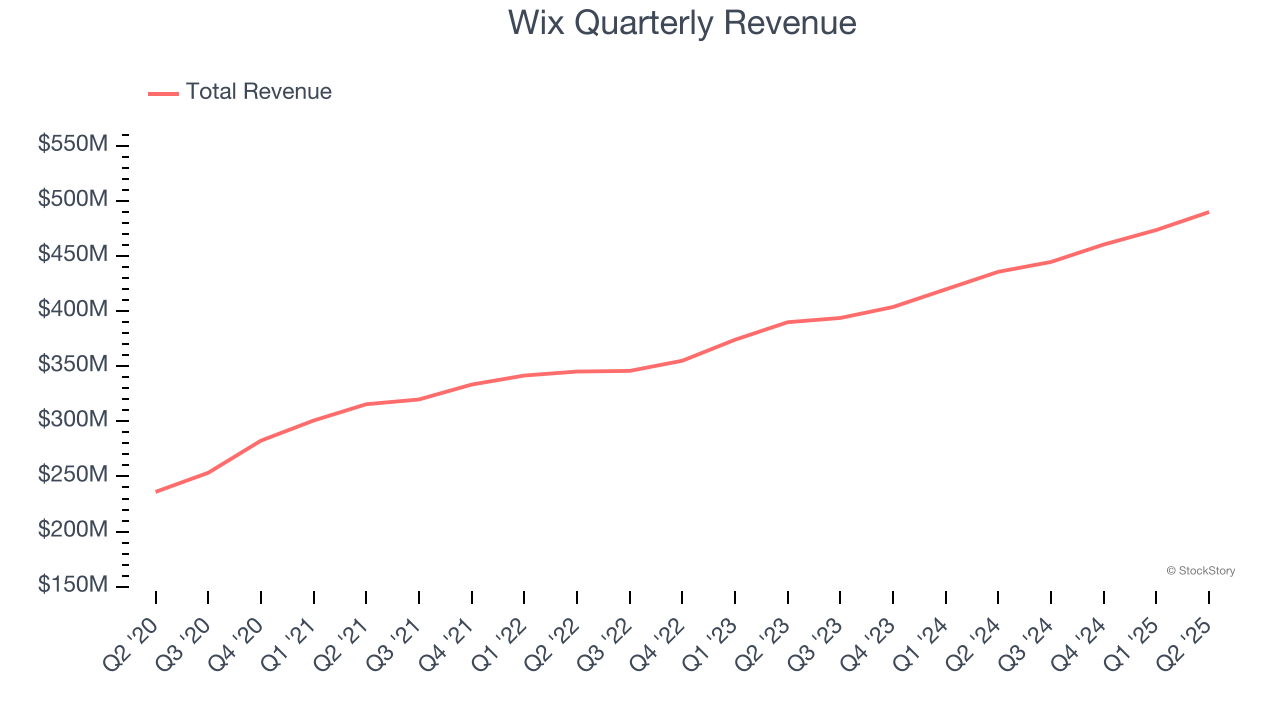
This quarter, Wix reported year-on-year revenue growth of 12.4%, and its $489.9 million of revenue exceeded Wall Street’s estimates by 0.6%. Company management is currently guiding for a 12.7% year-on-year increase in sales next quarter.
Looking further ahead, sell-side analysts expect revenue to grow 12.9% over the next 12 months, similar to its three-year rate. This projection is above the sector average and implies its newer products and services will spur better top-line performance.
Here at StockStory, we certainly understand the potential of thematic investing. Diverse winners from Microsoft (MSFT) to Alphabet (GOOG), Coca-Cola (KO) to Monster Beverage (MNST) could all have been identified as promising growth stories with a megatrend driving the growth. So, in that spirit, we’ve identified a relatively under-the-radar profitable growth stock benefiting from the rise of AI, available to you FREE via this link.
Customer Acquisition Efficiency
The customer acquisition cost (CAC) payback period represents the months required to recover the cost of acquiring a new customer. Essentially, it’s the break-even point for sales and marketing investments. A shorter CAC payback period is ideal, as it implies better returns on investment and business scalability.
Wix is efficient at acquiring new customers, and its CAC payback period checked in at 36.6 months this quarter. The company’s relatively fast recovery of its customer acquisition costs means it can attempt to spur growth by increasing its sales and marketing investments.
Key Takeaways from Wix’s Q2 Results
Revenue beat slightly, but management raised full-year revenue guidance, which is usually a sign of improving business momentum and confidence from the team. Operating profit and EPS also beat. Overall, this quarter was solid. The stock traded up 11.1% to $142 immediately after reporting.
Should you buy the stock or not? When making that decision, it’s important to consider its valuation, business qualities, as well as what has happened in the latest quarter. We cover that in our actionable full research report which you can read here, it’s free.