Beverage company Zevia (NYSE: ZVIA) reported Q2 CY2025 results topping the market’s revenue expectations, with sales up 10.1% year on year to $44.52 million. On the other hand, next quarter’s revenue guidance of $39 million was less impressive, coming in 4.1% below analysts’ estimates. Its GAAP loss of $0.01 per share was 78.3% above analysts’ consensus estimates.
Is now the time to buy Zevia? Find out by accessing our full research report, it’s free.
Zevia (ZVIA) Q2 CY2025 Highlights:
- Revenue: $44.52 million vs analyst estimates of $41.75 million (10.1% year-on-year growth, 6.6% beat)
- EPS (GAAP): -$0.01 vs analyst estimates of -$0.05 (78.3% beat)
- Adjusted EBITDA: $233,000 vs analyst estimates of -$2.33 million (0.5% margin, significant beat)
- Revenue Guidance for Q3 CY2025 is $39 million at the midpoint, below analyst estimates of $40.67 million
- EBITDA guidance for Q3 CY2025 is $3.65 million at the midpoint, above analyst estimates of -$3.1 million
- Operating Margin: -2.3%, up from -17.5% in the same quarter last year
- Free Cash Flow was -$1.42 million, down from $222,000 in the same quarter last year
- Market Capitalization: $216.7 million
Company Overview
With a primary focus on soda but also a presence in energy drinks and teas, Zevia (NYSE: ZVIA) is a better-for-you beverage company.
Revenue Growth
A company’s long-term performance is an indicator of its overall quality. Any business can put up a good quarter or two, but the best consistently grow over the long haul.
With $158.4 million in revenue over the past 12 months, Zevia is a small consumer staples company, which sometimes brings disadvantages compared to larger competitors benefiting from economies of scale and negotiating leverage with retailers.
As you can see below, Zevia struggled to increase demand as its $158.4 million of sales for the trailing 12 months was close to its revenue three years ago. To its credit, however, consumers bought more of its products - we’ll explore what this means in the "Volume Growth" section.
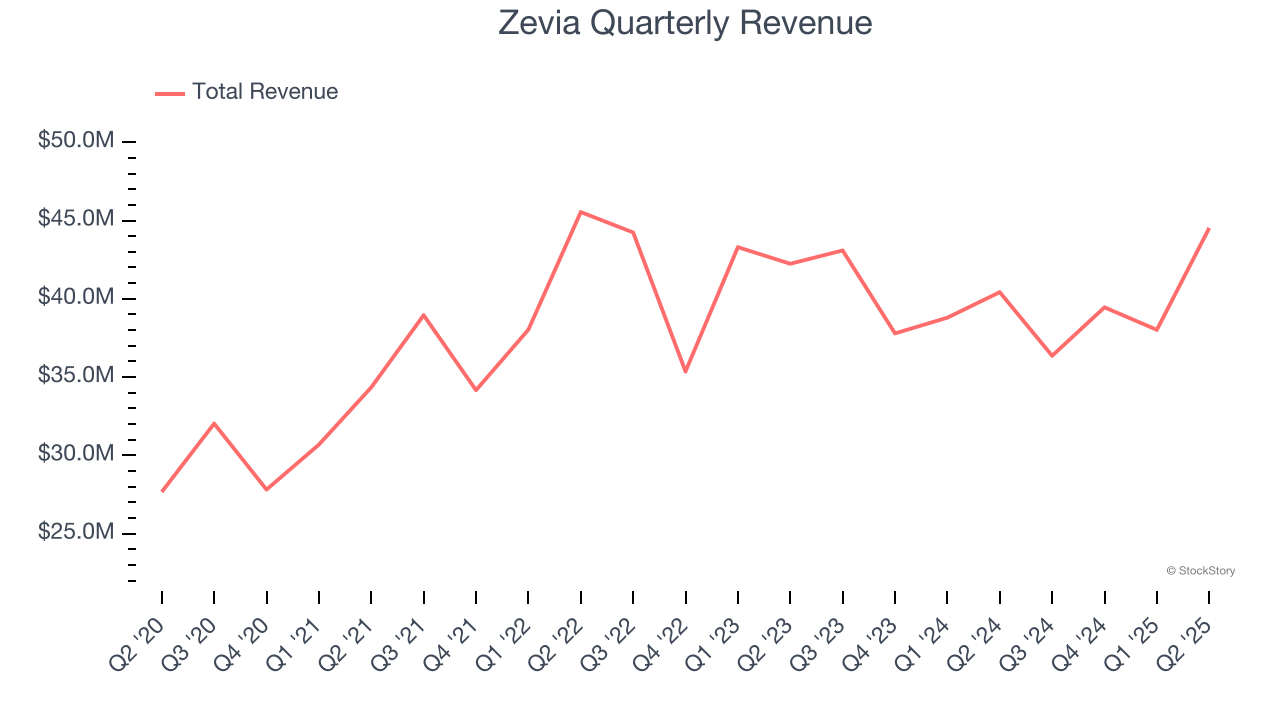
This quarter, Zevia reported year-on-year revenue growth of 10.1%, and its $44.52 million of revenue exceeded Wall Street’s estimates by 6.6%. Company management is currently guiding for a 7.2% year-on-year increase in sales next quarter.
Looking further ahead, sell-side analysts expect revenue to grow 4.7% over the next 12 months. While this projection implies its newer products will catalyze better top-line performance, it is still below the sector average.
Today’s young investors won’t have read the timeless lessons in Gorilla Game: Picking Winners In High Technology because it was written more than 20 years ago when Microsoft and Apple were first establishing their supremacy. But if we apply the same principles, then enterprise software stocks leveraging their own generative AI capabilities may well be the Gorillas of the future. So, in that spirit, we are excited to present our Special Free Report on a profitable, fast-growing enterprise software stock that is already riding the automation wave and looking to catch the generative AI next.
Cash Is King
Free cash flow isn't a prominently featured metric in company financials and earnings releases, but we think it's telling because it accounts for all operating and capital expenses, making it tough to manipulate. Cash is king.
Zevia’s demanding reinvestments have drained its resources over the last two years, putting it in a pinch and limiting its ability to return capital to investors. Its free cash flow margin averaged negative 7.3%, meaning it lit $7.25 of cash on fire for every $100 in revenue.
Taking a step back, an encouraging sign is that Zevia’s margin expanded by 11.1 percentage points over the last year. We have no doubt shareholders would like to continue seeing its cash conversion rise.
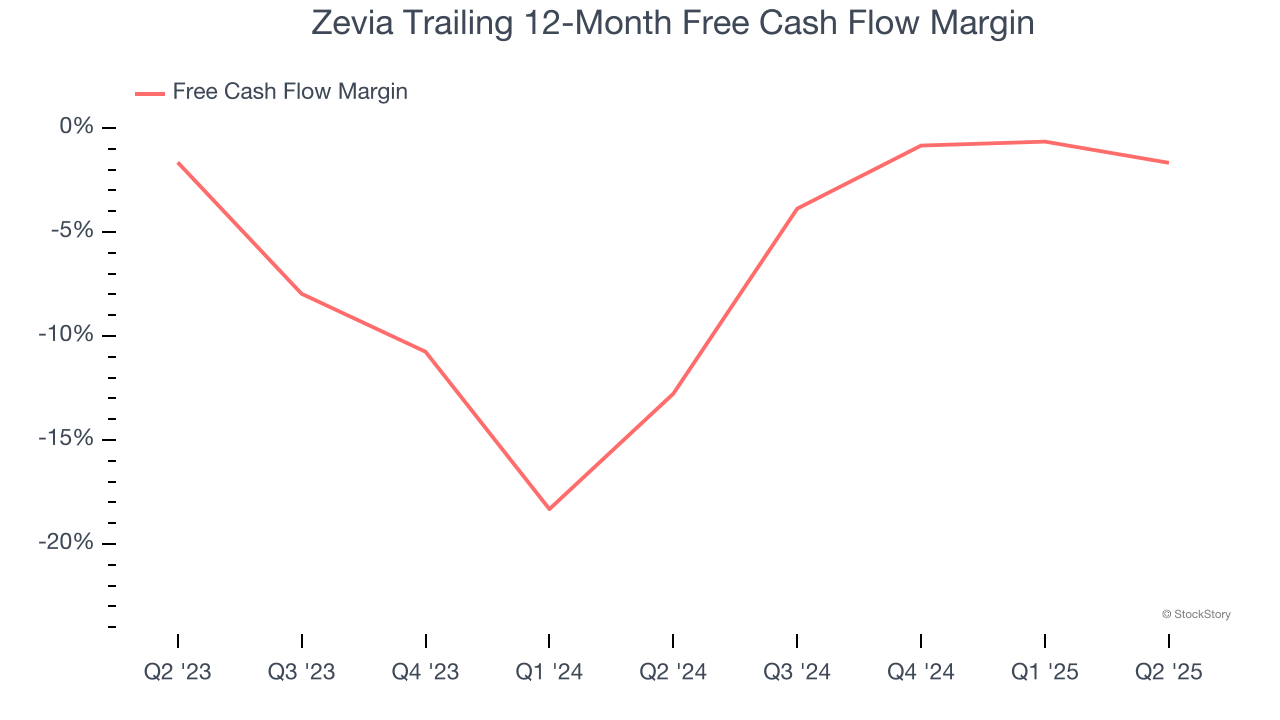
Zevia burned through $1.42 million of cash in Q2, equivalent to a negative 3.2% margin. The company’s cash burn increased meaningfully year on year while its cash conversion fell 3.7 percentage points. This relationship shows Zevia’s management team spent more cash this quarter but was less efficient at generating sales with that cash.
Key Takeaways from Zevia’s Q2 Results
We were impressed by Zevia’s optimistic EBITDA guidance for next quarter, which blew past analysts’ expectations. We were also excited its EPS outperformed Wall Street’s estimates by a wide margin. On the other hand, its revenue guidance for next quarter missed. Zooming out, we think this quarter featured some important positives. The stock traded up 8.4% to $3.73 immediately after reporting.
Zevia had an encouraging quarter, but one earnings result doesn’t necessarily make the stock a buy. Let’s see if this is a good investment. When making that decision, it’s important to consider its valuation, business qualities, as well as what has happened in the latest quarter. We cover that in our actionable full research report which you can read here, it’s free.