
Footwear company Crocs (NASDAQ: CROX) met Wall Street’s revenue expectations in Q2 CY2025, with sales up 3.4% year on year to $1.15 billion. On the other hand, next quarter’s revenue guidance of $956 million was less impressive, coming in 10.7% below analysts’ estimates. Its non-GAAP profit of $4.23 per share was 5.3% above analysts’ consensus estimates.
Is now the time to buy Crocs? Find out by accessing our full research report, it’s free.
Crocs (CROX) Q2 CY2025 Highlights:
- Revenue: $1.15 billion vs analyst estimates of $1.15 billion (3.4% year-on-year growth, in line)
- Adjusted EPS: $4.23 vs analyst estimates of $4.02 (5.3% beat)
- Adjusted EBITDA: $329 million vs analyst estimates of $315.8 million (28.6% margin, 4.2% beat)
- Revenue Guidance for Q3 CY2025 is $956 million at the midpoint, below analyst estimates of $1.07 billion
- Operating Margin: -37.2%, down from 29.3% in the same quarter last year due to noncash impairment charges related to the indefinite-lived HEYDUDE trademark and HEYDUDE Brand reporting unit goodwill of $430 million and $307 million, respectively, during the three months ended June 30, 2025
- Free Cash Flow Margin: 23.4%, down from 34.6% in the same quarter last year
- Constant Currency Revenue rose 2.7% year on year (4.8% in the same quarter last year)
- Market Capitalization: $5.9 billion
Company Overview
Founded in 2002, Crocs (NASDAQ: CROX) sells casual footwear and is known for its iconic clog shoe.
Revenue Growth
Reviewing a company’s long-term sales performance reveals insights into its quality. Any business can experience short-term success, but top-performing ones enjoy sustained growth for years. Thankfully, Crocs’s 28.3% annualized revenue growth over the last five years was exceptional. Its growth beat the average consumer discretionary company and shows its offerings resonate with customers.
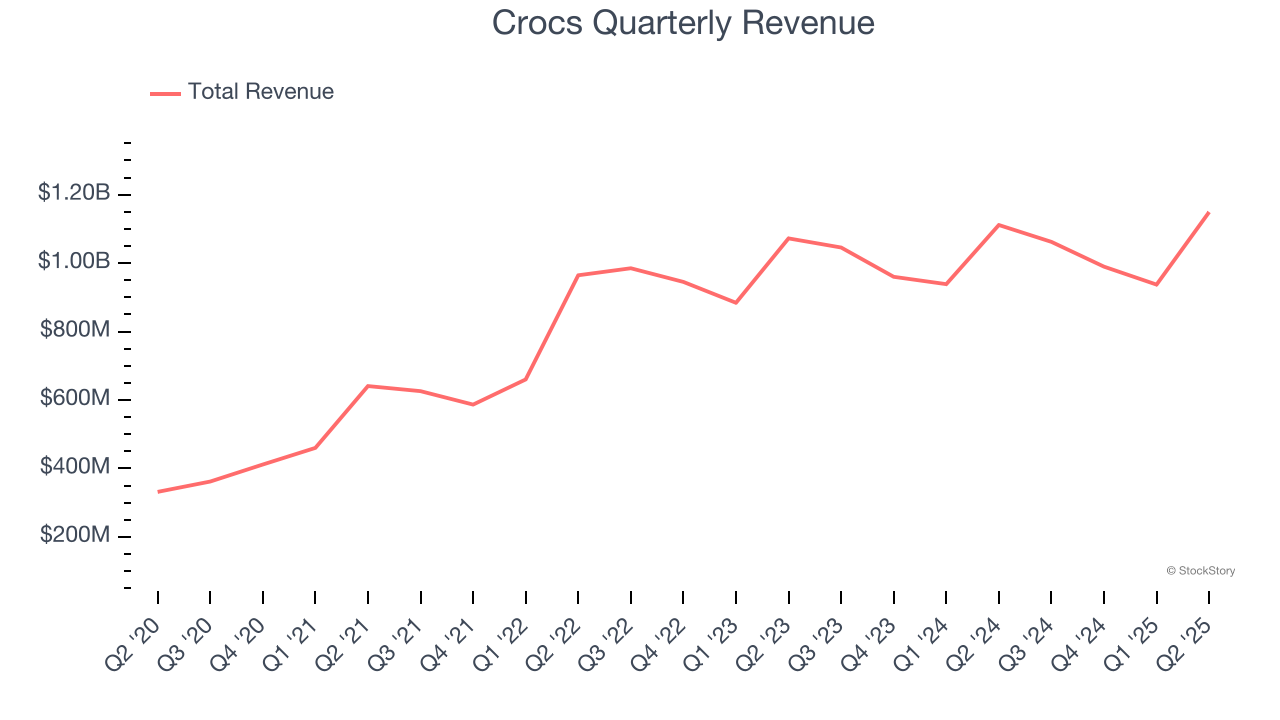
We at StockStory place the most emphasis on long-term growth, but within consumer discretionary, a stretched historical view may miss a company riding a successful new product or trend. Crocs’s recent performance shows its demand has slowed significantly as its annualized revenue growth of 3.2% over the last two years was well below its five-year trend. 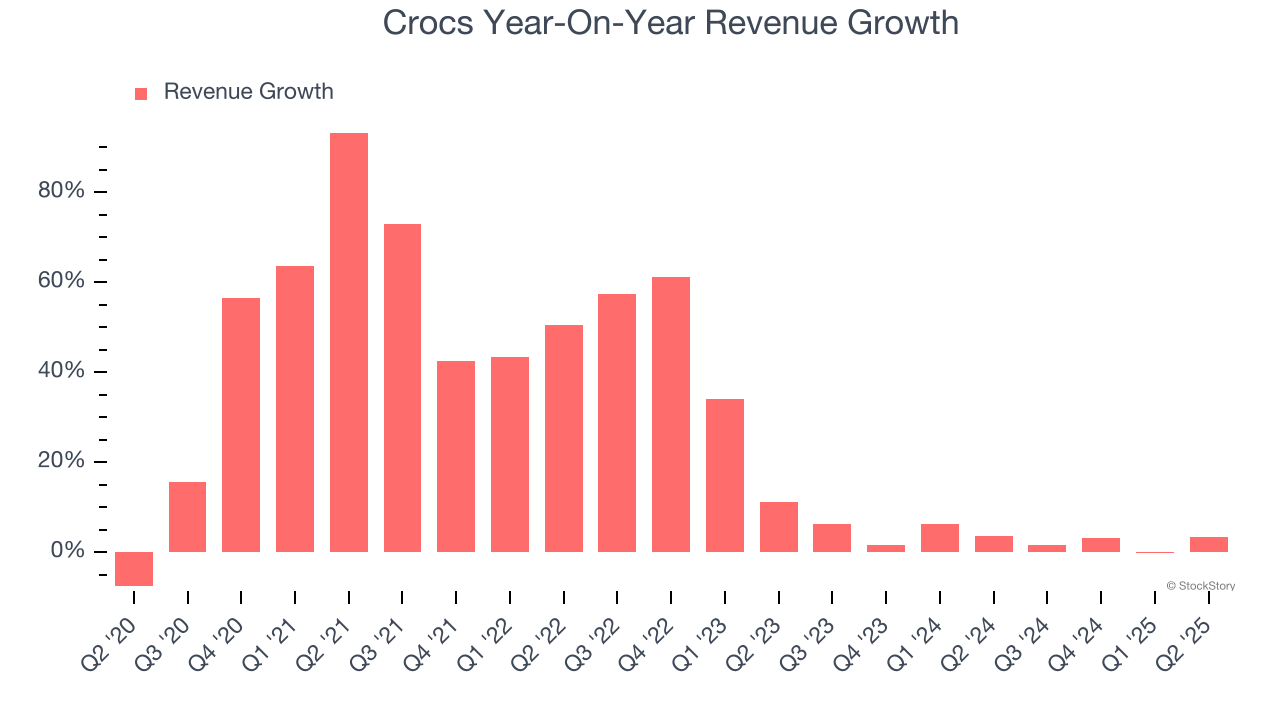
We can better understand the company’s sales dynamics by analyzing its constant currency revenue, which excludes currency movements that are outside their control and not indicative of demand. Over the last two years, its constant currency sales averaged 3.6% year-on-year growth. Because this number aligns with its normal revenue growth, we can see that Crocs has properly hedged its foreign currency exposure. 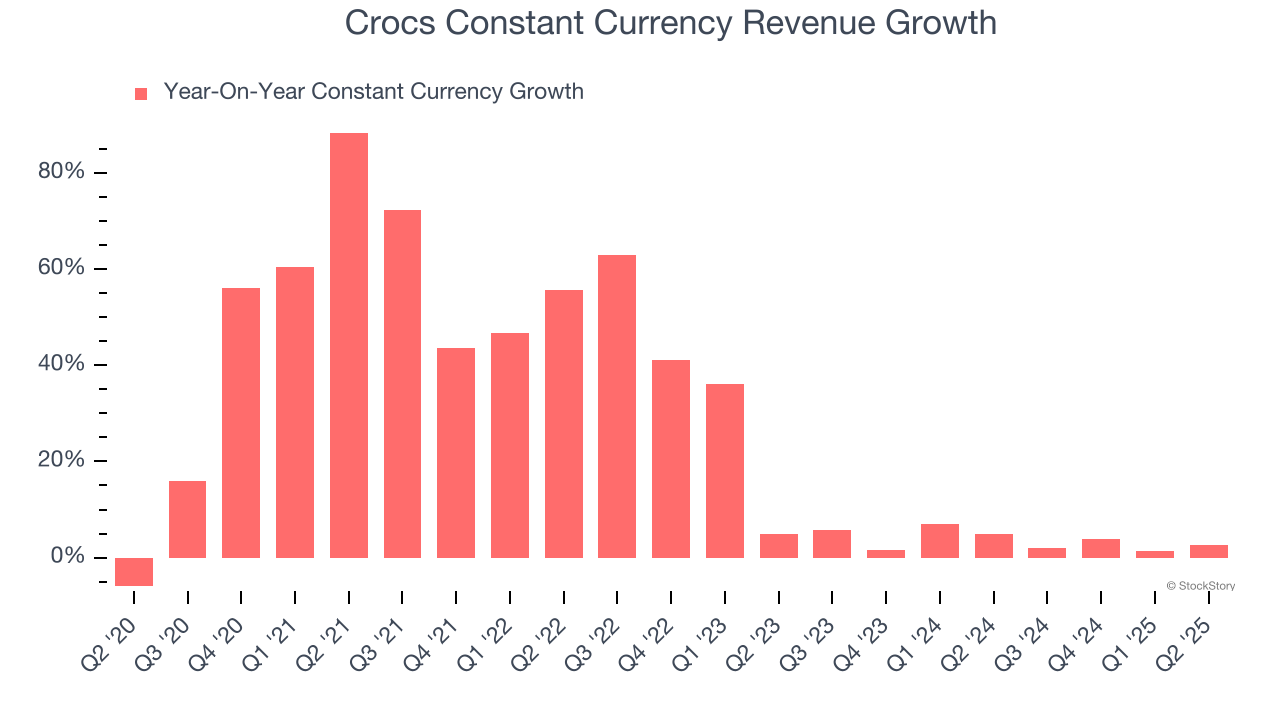
This quarter, Crocs grew its revenue by 3.4% year on year, and its $1.15 billion of revenue was in line with Wall Street’s estimates. Company management is currently guiding for a 10% year-on-year decline in sales next quarter.
Looking further ahead, sell-side analysts expect revenue to decline by 1.8% over the next 12 months, a deceleration versus the last two years. This projection doesn't excite us and implies its products and services will face some demand challenges.
Today’s young investors won’t have read the timeless lessons in Gorilla Game: Picking Winners In High Technology because it was written more than 20 years ago when Microsoft and Apple were first establishing their supremacy. But if we apply the same principles, then enterprise software stocks leveraging their own generative AI capabilities may well be the Gorillas of the future. So, in that spirit, we are excited to present our Special Free Report on a profitable, fast-growing enterprise software stock that is already riding the automation wave and looking to catch the generative AI next.
Operating Margin
Operating margin is an important measure of profitability as it shows the portion of revenue left after accounting for all core expenses – everything from the cost of goods sold to advertising and wages. It’s also useful for comparing profitability across companies with different levels of debt and tax rates because it excludes interest and taxes.
Crocs’s operating margin has shrunk over the last 12 months, but it still averaged 15.9% over the last two years, solid for a consumer discretionary business. This shows it generally manages its expenses well, and its elite historical revenue growth also suggests its margin dropped because it ramped up investments to capture market share. We’ll keep a close eye to see if this strategy pays off.
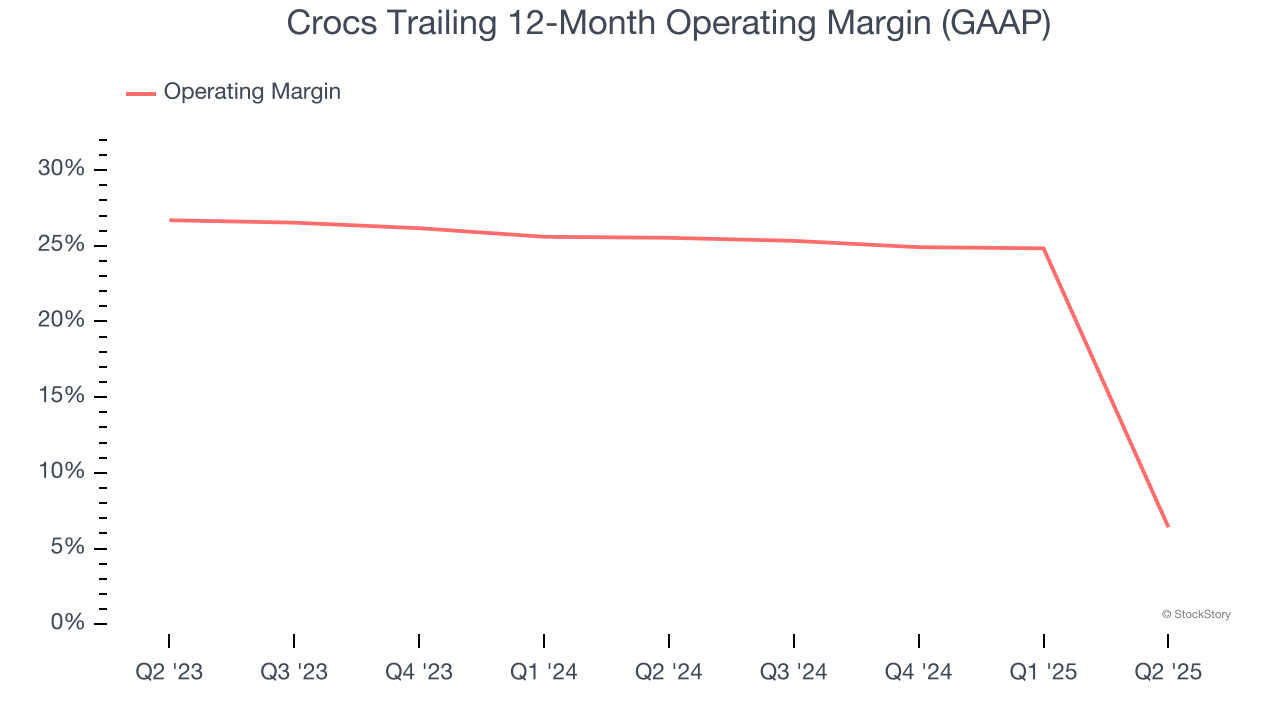
In Q2, Crocs generated an operating margin profit margin of negative 37.2%, down 66.5 percentage points year on year due to noncash impairment charges related to the indefinite-lived HEYDUDE trademark and HEYDUDE Brand reporting unit goodwill of $430 million and $307 million, respectively, during the three months ended June 30, 2025.
Earnings Per Share
We track the long-term change in earnings per share (EPS) for the same reason as long-term revenue growth. Compared to revenue, however, EPS highlights whether a company’s growth is profitable.
Crocs’s EPS grew at an astounding 47.4% compounded annual growth rate over the last five years, higher than its 28.3% annualized revenue growth. However, this alone doesn’t tell us much about its business quality because its operating margin didn’t improve.
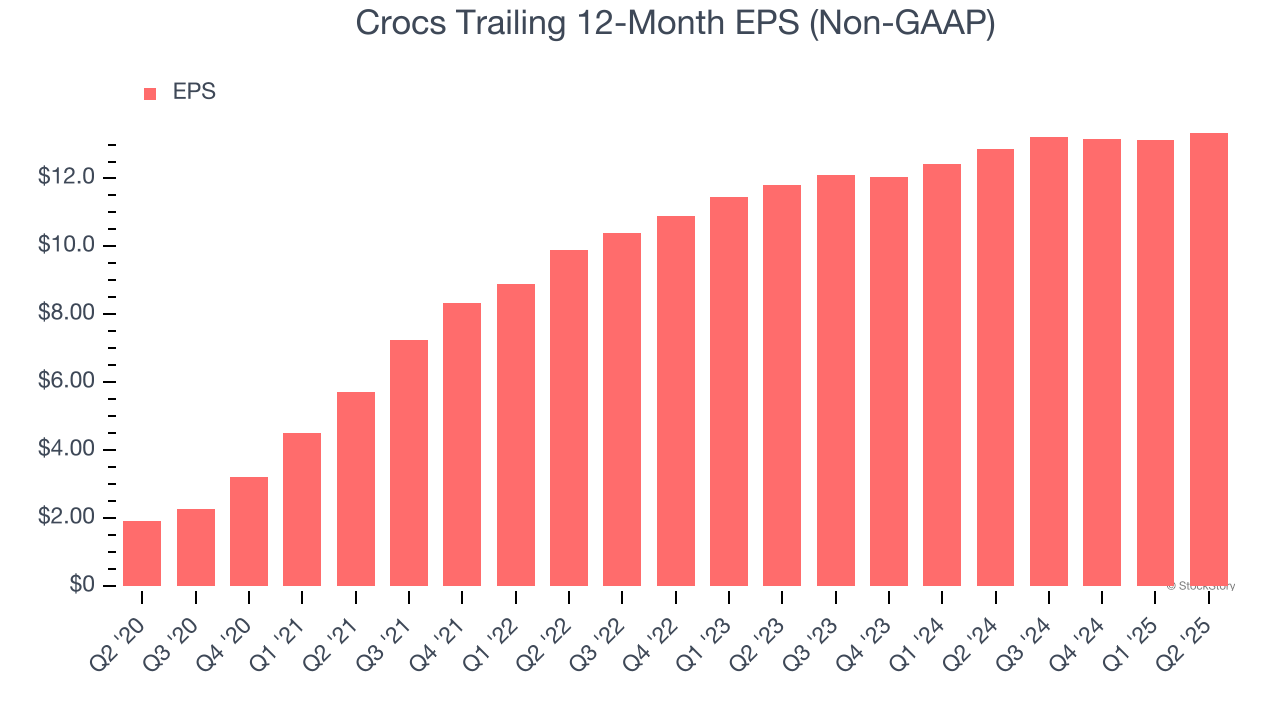
In Q2, Crocs reported adjusted EPS at $4.23, up from $4.01 in the same quarter last year. This print beat analysts’ estimates by 5.3%. Over the next 12 months, Wall Street expects Crocs’s full-year EPS of $13.35 to shrink by 4.5%.
Key Takeaways from Crocs’s Q2 Results
It was encouraging to see Crocs beat analysts’ adjusted operating income expectations this quarter. We were also happy its EPS outperformed Wall Street’s estimates. On the other hand, its revenue guidance for next quarter missed and its constant currency revenue fell slightly short of Wall Street’s estimates. Overall, this quarter could have been better. The stock traded down 27.3% to $76.55 immediately after reporting.
So should you invest in Crocs right now? What happened in the latest quarter matters, but not as much as longer-term business quality and valuation, when deciding whether to invest in this stock. We cover that in our actionable full research report which you can read here, it’s free.


