
Business transformation services company Genpact (NYSE: G) announced better-than-expected revenue in Q2 CY2025, with sales up 6.6% year on year to $1.25 billion. Guidance for next quarter’s revenue was better than expected at $1.26 billion at the midpoint, 0.8% above analysts’ estimates. Its non-GAAP profit of $0.88 per share was 3.1% above analysts’ consensus estimates.
Is now the time to buy Genpact? Find out by accessing our full research report, it’s free.
Genpact (G) Q2 CY2025 Highlights:
- Revenue: $1.25 billion vs analyst estimates of $1.23 billion (6.6% year-on-year growth, 1.9% beat)
- Adjusted EPS: $0.88 vs analyst estimates of $0.85 (3.1% beat)
- Adjusted EBITDA: $205.5 million vs analyst estimates of $228.6 million (16.4% margin, 10.1% miss)
- The company lifted its revenue guidance for the full year to $5.01 billion at the midpoint from $4.93 billion, a 1.5% increase
- Management raised its full-year Adjusted EPS guidance to $3.55 at the midpoint, a 2.3% increase
- Operating Margin: 14.3%, in line with the same quarter last year
- Free Cash Flow Margin: 12.4%, down from 16.1% in the same quarter last year
- Constant Currency Revenue rose 6.2% year on year, in line with the same quarter last year
- Market Capitalization: $7.38 billion
Company Overview
Originally spun off from General Electric in 2005 to provide business process services, Genpact (NYSE: G) is a global professional services firm that helps businesses transform their operations through digital technology, AI, and data analytics solutions.
Revenue Growth
A company’s long-term sales performance is one signal of its overall quality. Even a bad business can shine for one or two quarters, but a top-tier one grows for years.
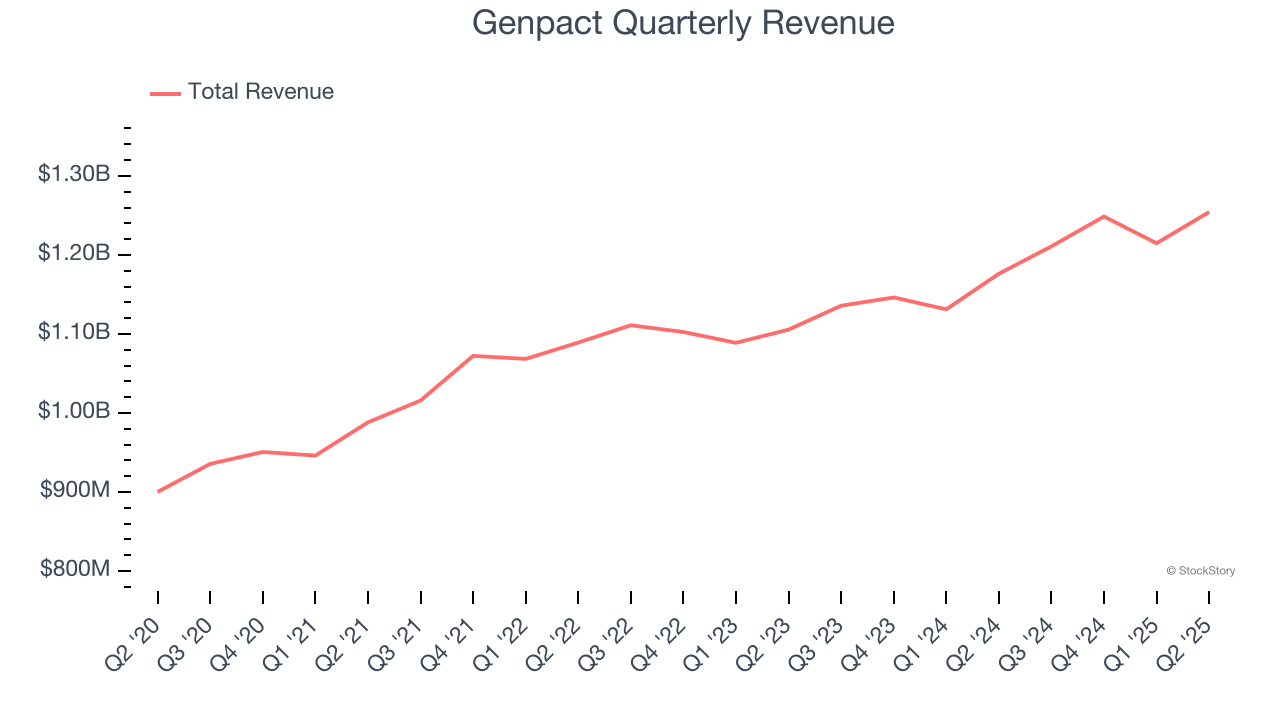
With $4.93 billion in revenue over the past 12 months, Genpact is one of the larger companies in the business services industry and benefits from a well-known brand that influences purchasing decisions.
As you can see below, Genpact’s sales grew at a decent 6.2% compounded annual growth rate over the last five years. This shows its offerings generated slightly more demand than the average business services company, a useful starting point for our analysis.
We at StockStory place the most emphasis on long-term growth, but within business services, a half-decade historical view may miss recent innovations or disruptive industry trends. Genpact’s annualized revenue growth of 5.7% over the last two years aligns with its five-year trend, suggesting its demand was stable. 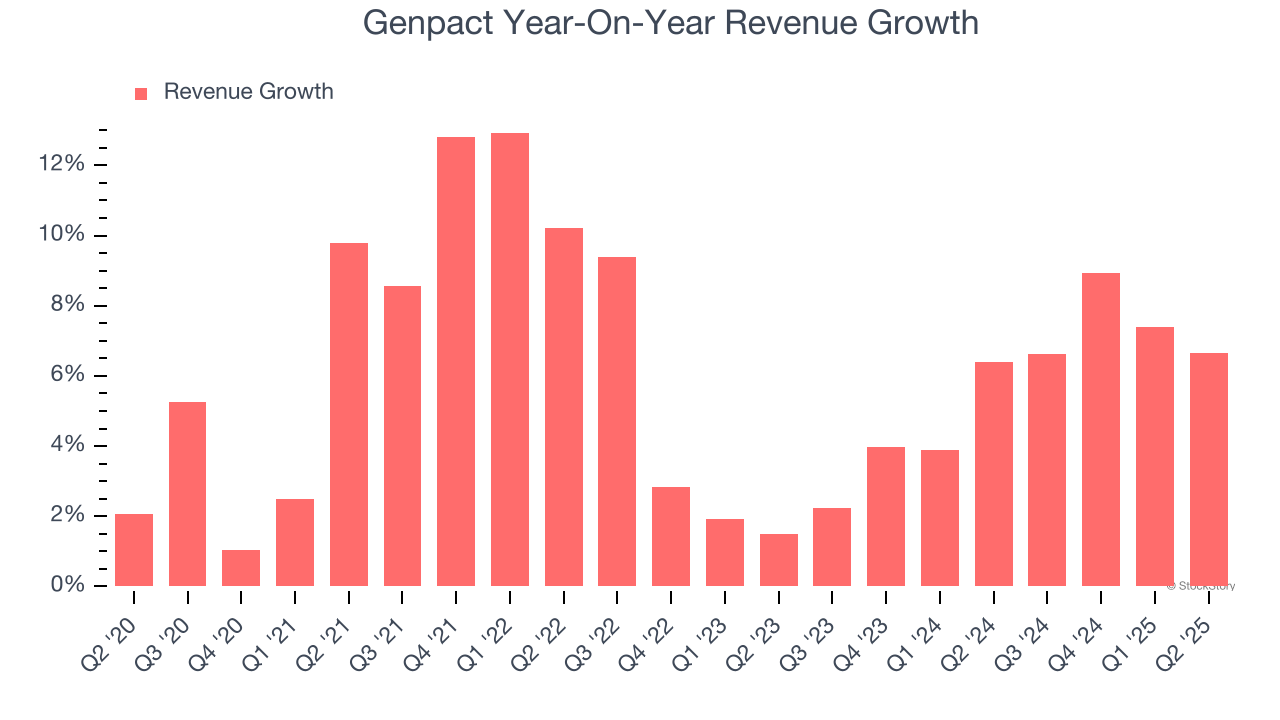
Genpact also reports sales performance excluding currency movements, which are outside the company’s control and not indicative of demand. Over the last two years, its constant currency sales averaged 5.9% year-on-year growth. Because this number aligns with its normal revenue growth, we can see that Genpact has properly hedged its foreign currency exposure. 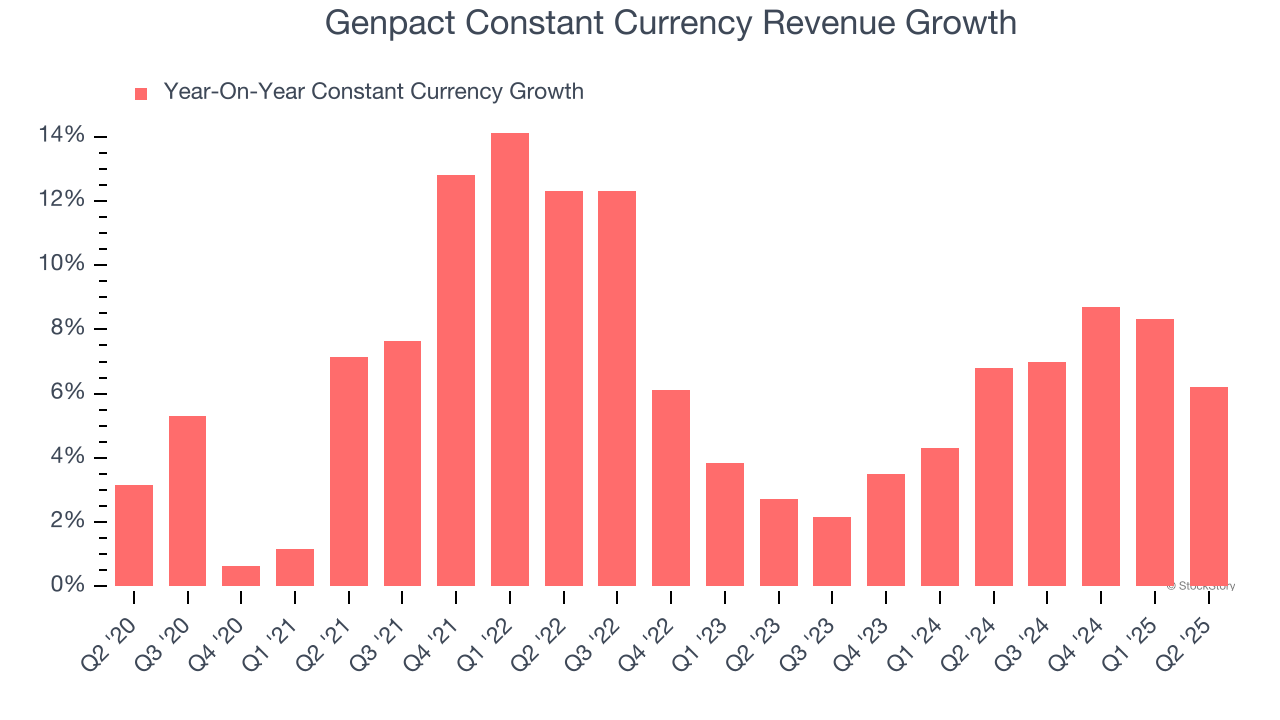
This quarter, Genpact reported year-on-year revenue growth of 6.6%, and its $1.25 billion of revenue exceeded Wall Street’s estimates by 1.9%. Company management is currently guiding for a 4.4% year-on-year increase in sales next quarter.
Looking further ahead, sell-side analysts expect revenue to grow 3.8% over the next 12 months, a slight deceleration versus the last two years. This projection is underwhelming and suggests its products and services will face some demand challenges.
Unless you’ve been living under a rock, it should be obvious by now that generative AI is going to have a huge impact on how large corporations do business. While Nvidia and AMD are trading close to all-time highs, we prefer a lesser-known (but still profitable) stock benefiting from the rise of AI. Click here to access our free report one of our favorites growth stories.
Adjusted Operating Margin
Genpact’s adjusted operating margin might fluctuated slightly over the last 12 months but has generally stayed the same, averaging 16.8% over the last five years. This profitability was top-notch for a business services business, showing it’s an well-run company with an efficient cost structure.
Analyzing the trend in its profitability, Genpact’s adjusted operating margin might fluctuated slightly but has generally stayed the same over the last five years. This raises questions about the company’s expense base because its revenue growth should have given it leverage on its fixed costs, resulting in better economies of scale and profitability.
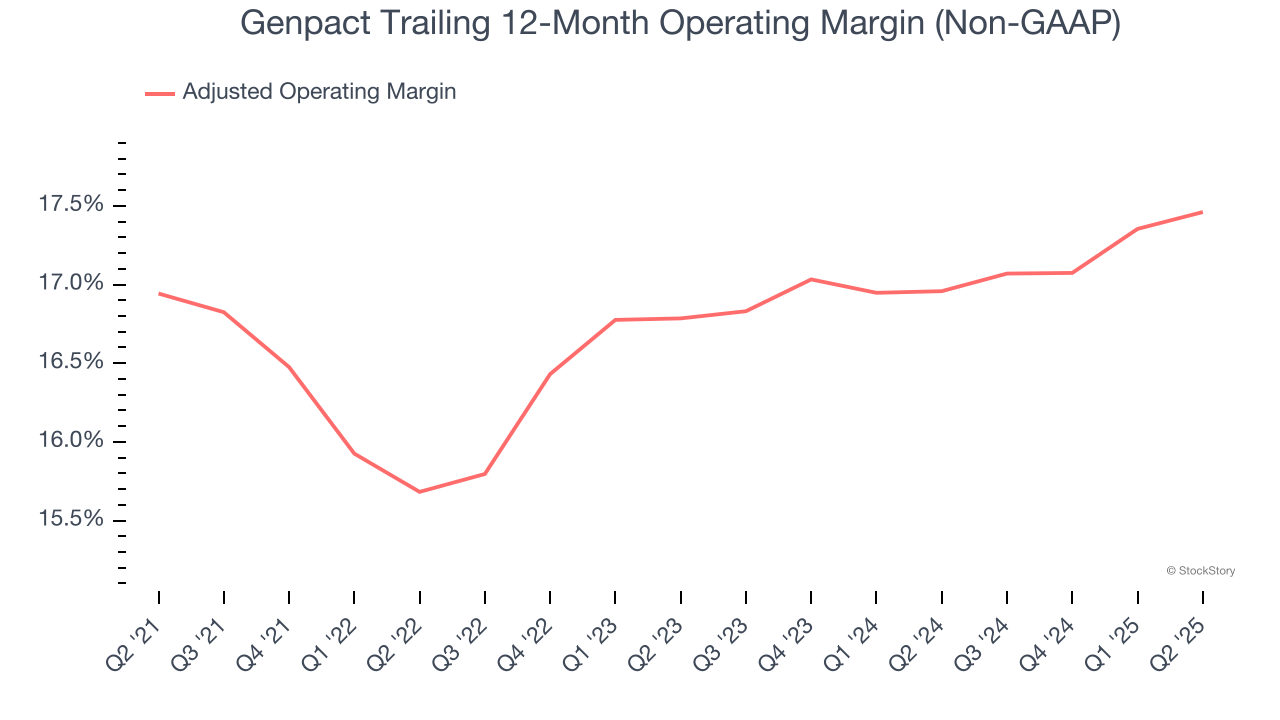
In Q2, Genpact generated an adjusted operating margin profit margin of 17.3%, in line with the same quarter last year. This indicates the company’s overall cost structure has been relatively stable.
Earnings Per Share
Revenue trends explain a company’s historical growth, but the long-term change in earnings per share (EPS) points to the profitability of that growth – for example, a company could inflate its sales through excessive spending on advertising and promotions.
Genpact’s EPS grew at a solid 9.8% compounded annual growth rate over the last five years, higher than its 6.2% annualized revenue growth. This tells us the company became more profitable on a per-share basis as it expanded.
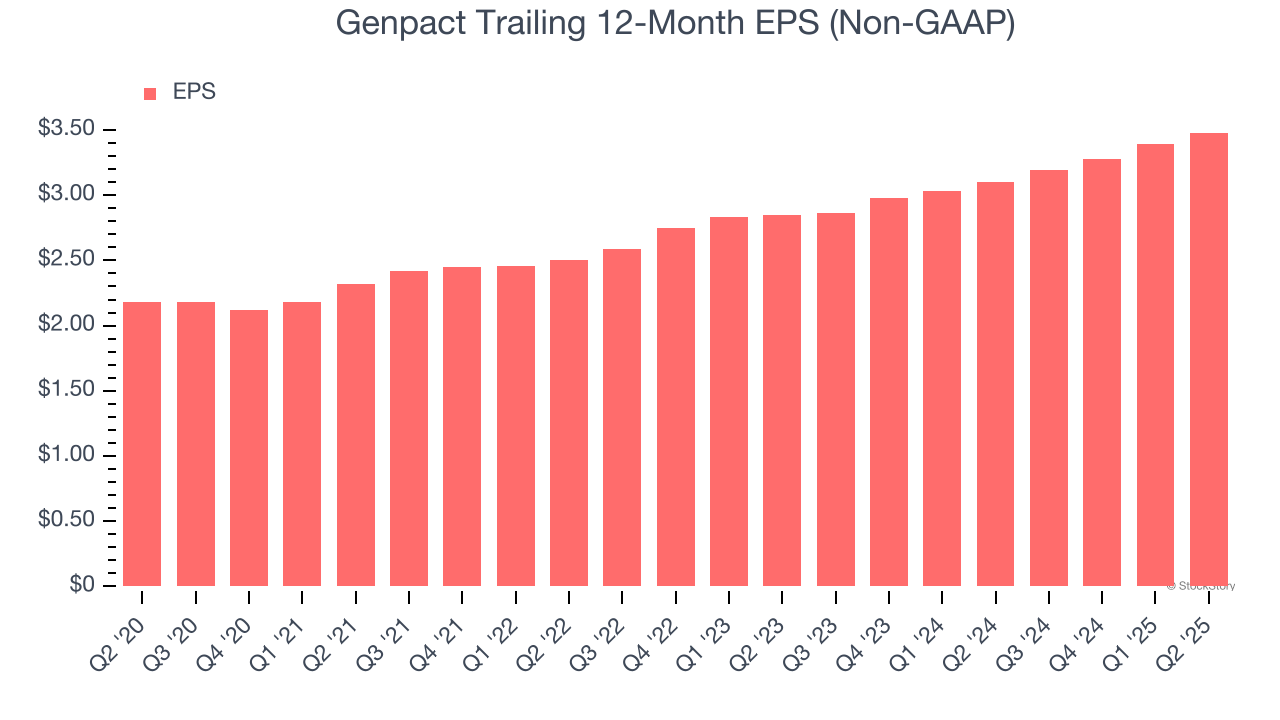
Like with revenue, we analyze EPS over a more recent period because it can provide insight into an emerging theme or development for the business.
For Genpact, its two-year annual EPS growth of 10.5% is similar to its five-year trend, implying stable earnings power.
In Q2, Genpact reported adjusted EPS at $0.88, up from $0.79 in the same quarter last year. This print beat analysts’ estimates by 3.1%. Over the next 12 months, Wall Street expects Genpact’s full-year EPS of $3.48 to grow 4%.
Key Takeaways from Genpact’s Q2 Results
We enjoyed seeing Genpact beat analysts’ constant currency revenue and EPS expectations this quarter. We were also happy it raised its full-year guidance. Overall, we think this was a solid quarter with some key areas of upside. The stock traded up 5.3% to $43.92 immediately after reporting.
Genpact put up rock-solid earnings, but one quarter doesn’t necessarily make the stock a buy. Let’s see if this is a good investment. When making that decision, it’s important to consider its valuation, business qualities, as well as what has happened in the latest quarter. We cover that in our actionable full research report which you can read here, it’s free.