
Blood products company Haemonetics (NYSE: HAE). reported Q2 CY2025 results topping the market’s revenue expectations, but sales fell by 4.4% year on year to $321.4 million. Its non-GAAP profit of $1.10 per share was 8.3% above analysts’ consensus estimates.
Is now the time to buy Haemonetics? Find out by accessing our full research report, it’s free.
Haemonetics (HAE) Q2 CY2025 Highlights:
- Revenue: $321.4 million vs analyst estimates of $301.6 million (4.4% year-on-year decline, 6.6% beat)
- Adjusted EPS: $1.10 vs analyst estimates of $1.02 (8.3% beat)
- Adjusted EBITDA: $91.94 million vs analyst estimates of $93.68 million (28.6% margin, 1.9% miss)
- Management reiterated its full-year Adjusted EPS guidance of $4.85 at the midpoint
- Operating Margin: 16.8%, up from 11.8% in the same quarter last year
- Free Cash Flow was $13.64 million, up from -$33.08 million in the same quarter last year
- Organic Revenue rose 12.9% year on year (2.8% in the same quarter last year)
- Market Capitalization: $3.64 billion
Company Overview
With roots dating back to 1971 and a mission to improve blood-related healthcare, Haemonetics (NYSE: HAE) provides specialized medical devices and software for blood collection, processing, and management across plasma centers, blood banks, and hospitals.
Revenue Growth
Examining a company’s long-term performance can provide clues about its quality. Even a bad business can shine for one or two quarters, but a top-tier one grows for years. Unfortunately, Haemonetics’s 7.3% annualized revenue growth over the last five years was mediocre. This fell short of our benchmark for the healthcare sector and is a tough starting point for our analysis.
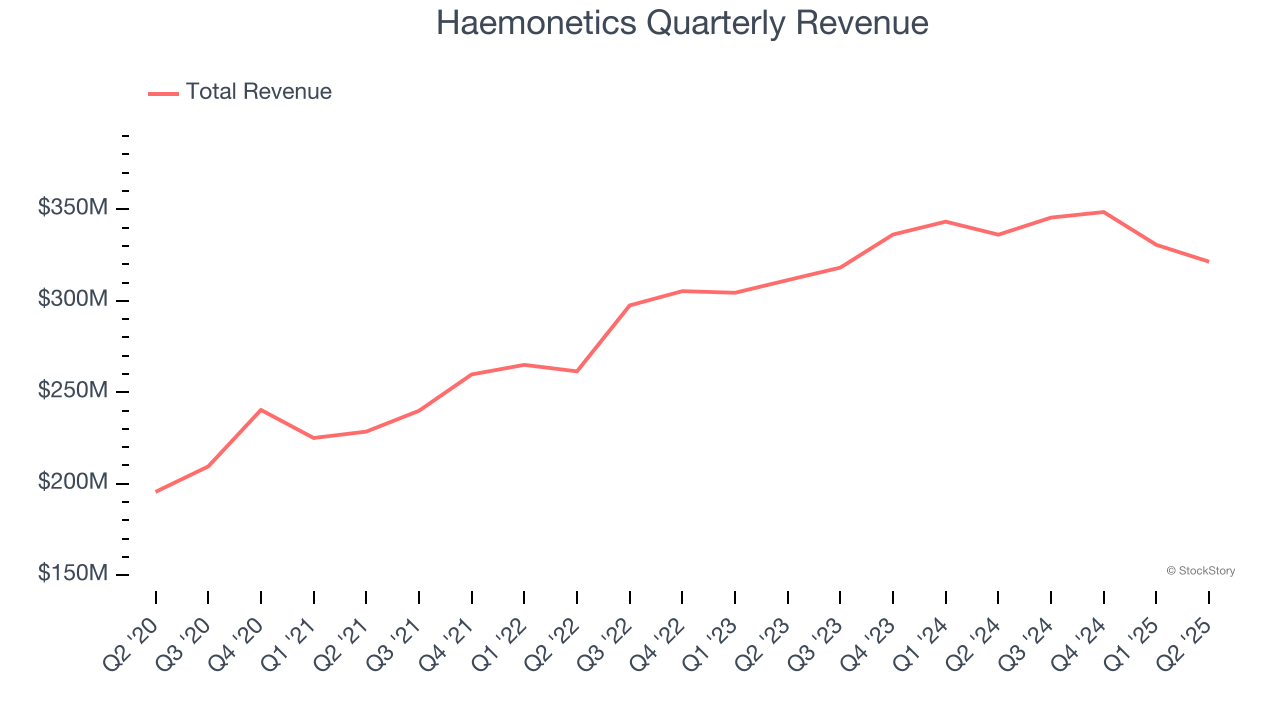
Long-term growth is the most important, but within healthcare, a half-decade historical view may miss new innovations or demand cycles. Haemonetics’s recent performance shows its demand has slowed as its annualized revenue growth of 5.1% over the last two years was below its five-year trend. 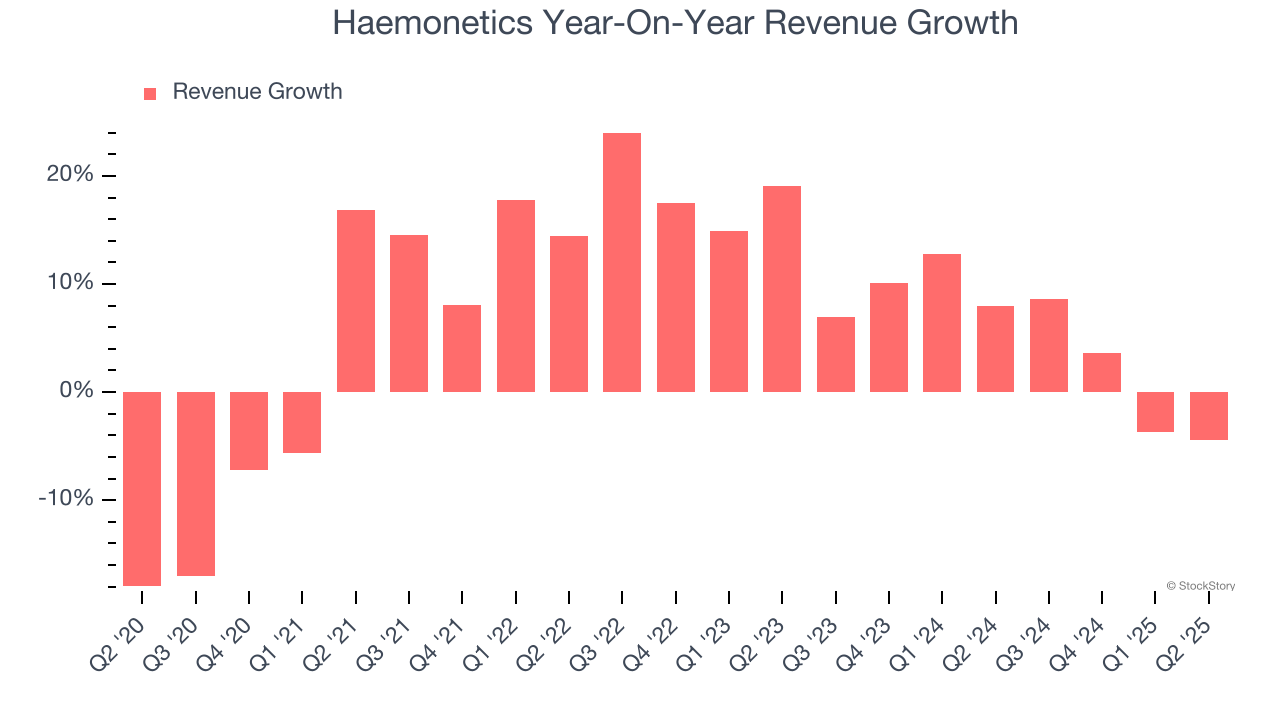
We can dig further into the company’s sales dynamics by analyzing its organic revenue, which strips out one-time events like acquisitions and currency fluctuations that don’t accurately reflect its fundamentals. Over the last two years, Haemonetics’s organic revenue averaged 5.8% year-on-year growth. Because this number aligns with its two-year revenue growth, we can see the company’s core operations (not acquisitions and divestitures) drove most of its results. 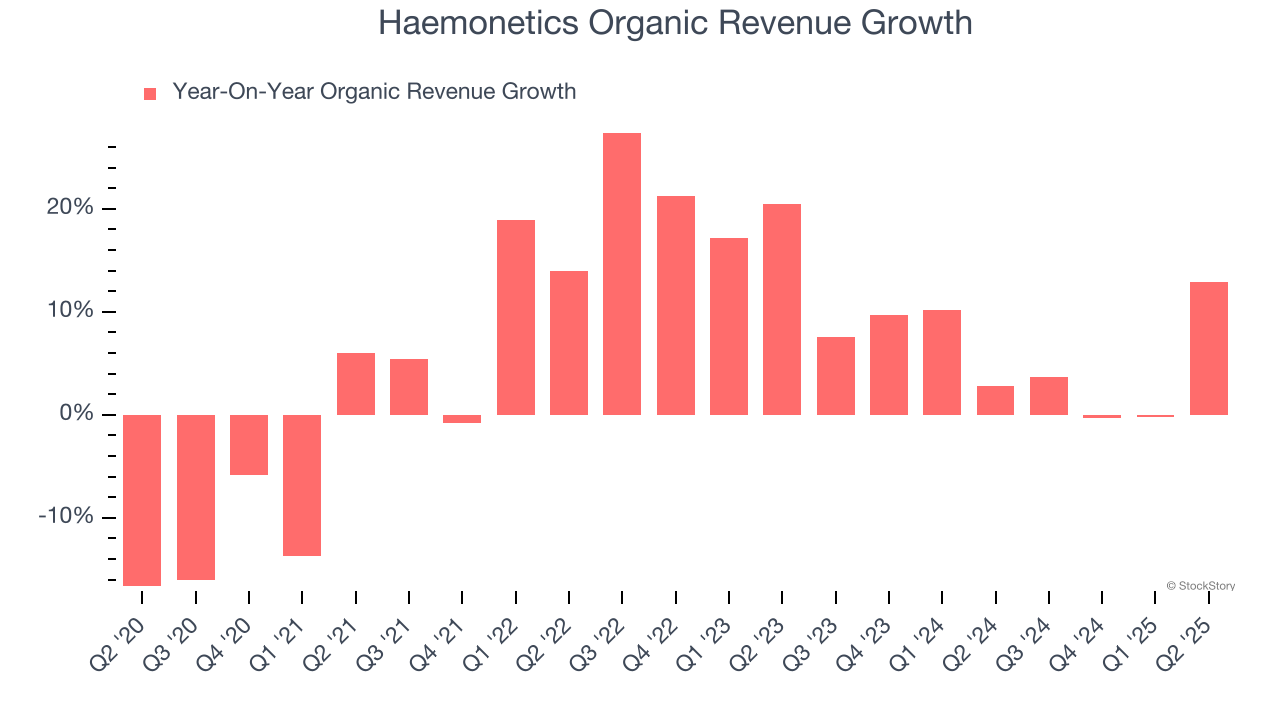
This quarter, Haemonetics’s revenue fell by 4.4% year on year to $321.4 million but beat Wall Street’s estimates by 6.6%.
Looking ahead, sell-side analysts expect revenue to decline by 1.8% over the next 12 months, a deceleration versus the last two years. This projection doesn't excite us and indicates its products and services will face some demand challenges.
Here at StockStory, we certainly understand the potential of thematic investing. Diverse winners from Microsoft (MSFT) to Alphabet (GOOG), Coca-Cola (KO) to Monster Beverage (MNST) could all have been identified as promising growth stories with a megatrend driving the growth. So, in that spirit, we’ve identified a relatively under-the-radar profitable growth stock benefiting from the rise of AI, available to you FREE via this link.
Operating Margin
Haemonetics has done a decent job managing its cost base over the last five years. The company has produced an average operating margin of 13%, higher than the broader healthcare sector.
Looking at the trend in its profitability, Haemonetics’s operating margin rose by 8.7 percentage points over the last five years, as its sales growth gave it operating leverage. Zooming in on its more recent performance, we can see the company’s trajectory is intact as its margin has also increased by 2.8 percentage points on a two-year basis.
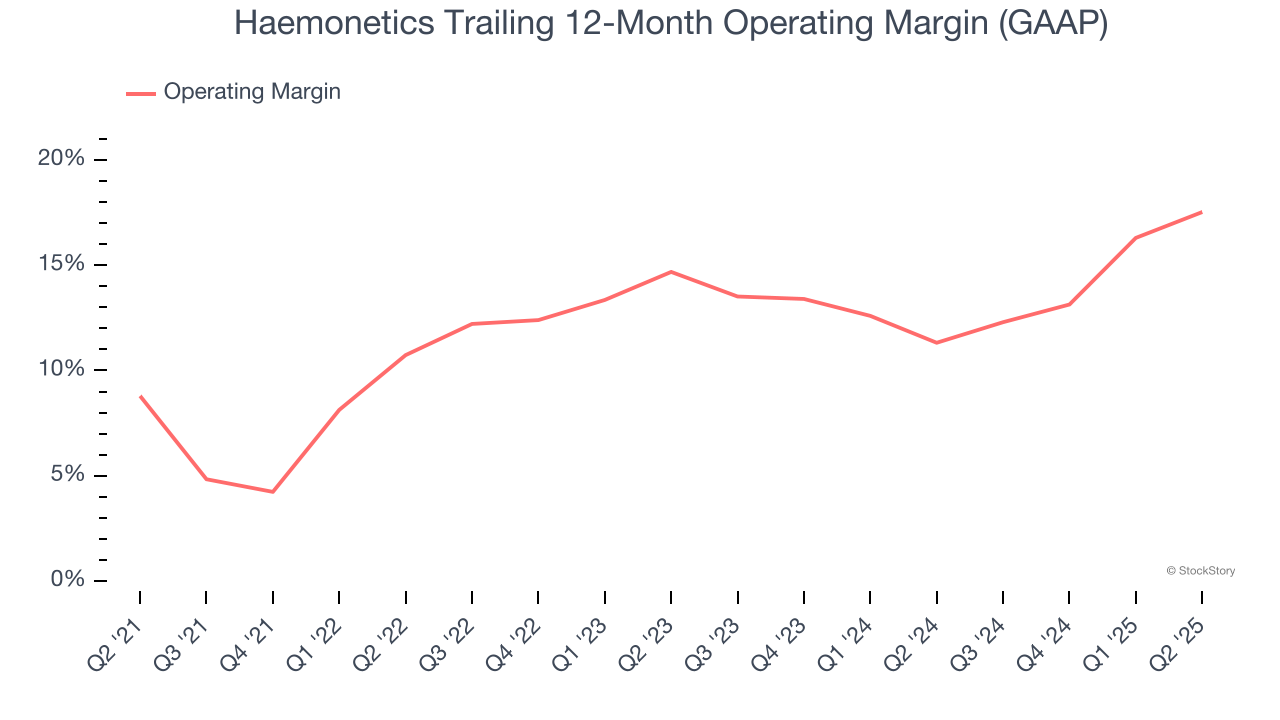
This quarter, Haemonetics generated an operating margin profit margin of 16.8%, up 4.9 percentage points year on year. This increase was a welcome development, especially since its revenue fell, showing it was more efficient because it scaled down its expenses.
Earnings Per Share
Revenue trends explain a company’s historical growth, but the long-term change in earnings per share (EPS) points to the profitability of that growth – for example, a company could inflate its sales through excessive spending on advertising and promotions.
Haemonetics’s EPS grew at a remarkable 9.5% compounded annual growth rate over the last five years, higher than its 7.3% annualized revenue growth. This tells us the company became more profitable on a per-share basis as it expanded.
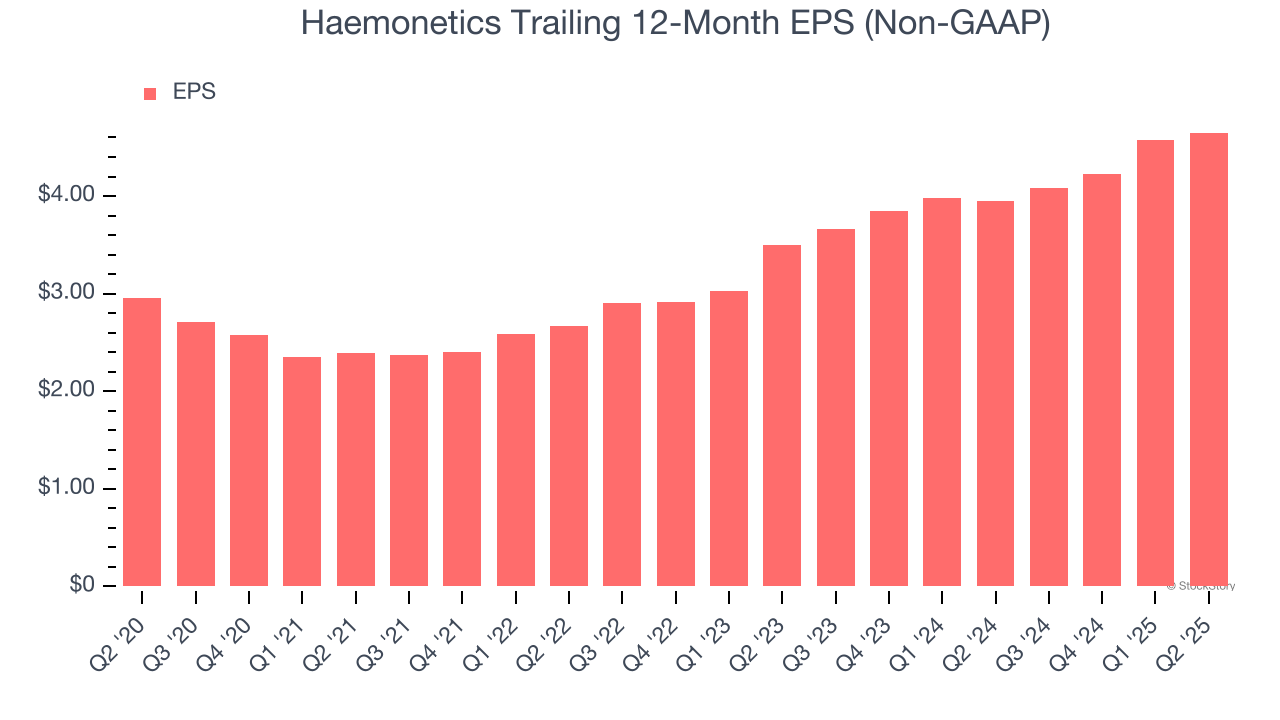
We can take a deeper look into Haemonetics’s earnings quality to better understand the drivers of its performance. As we mentioned earlier, Haemonetics’s operating margin expanded by 8.7 percentage points over the last five years. On top of that, its share count shrank by 5.6%. These are positive signs for shareholders because improving profitability and share buybacks turbocharge EPS growth relative to revenue growth. 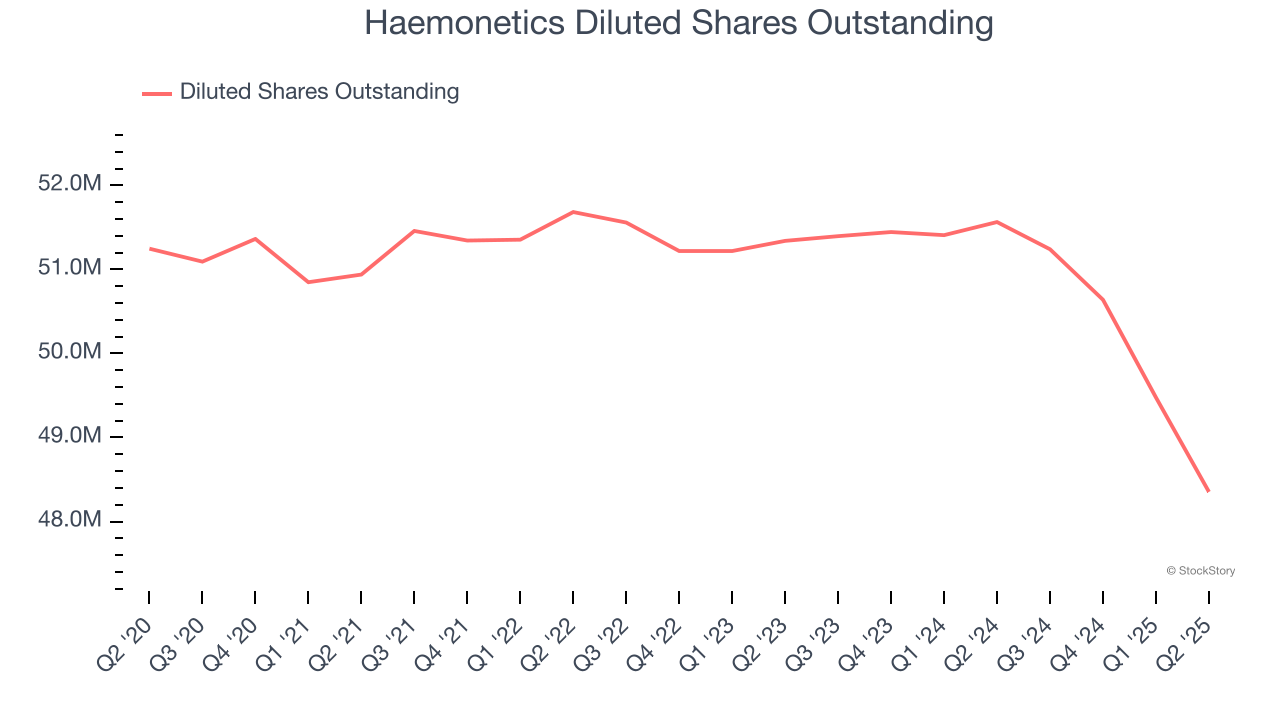
In Q2, Haemonetics reported adjusted EPS at $1.10, up from $1.02 in the same quarter last year. This print beat analysts’ estimates by 8.3%. Over the next 12 months, Wall Street expects Haemonetics’s full-year EPS of $4.65 to grow 7.7%.
Key Takeaways from Haemonetics’s Q2 Results
We were impressed by how significantly Haemonetics blew past analysts’ organic revenue expectations this quarter. We were also excited its revenue outperformed Wall Street’s estimates by a wide margin. On the other hand, its full-year EPS guidance was in line. Zooming out, we think this was a solid print. The market seemed to be hoping for more, and the stock traded down 24% to $57.54 immediately after reporting.
So should you invest in Haemonetics right now? What happened in the latest quarter matters, but not as much as longer-term business quality and valuation, when deciding whether to invest in this stock. We cover that in our actionable full research report which you can read here, it’s free.