Software development tools maker JFrog (NASDAQ: FROG) announced better-than-expected revenue in Q2 CY2025, with sales up 23.5% year on year to $127.2 million. Guidance for next quarter’s revenue was better than expected at $128 million at the midpoint, 1.6% above analysts’ estimates. Its non-GAAP profit of $0.18 per share was 10.1% above analysts’ consensus estimates.
Is now the time to buy JFrog? Find out by accessing our full research report, it’s free.
JFrog (FROG) Q2 CY2025 Highlights:
- Revenue: $127.2 million vs analyst estimates of $122.9 million (23.5% year-on-year growth, 3.5% beat)
- Adjusted EPS: $0.18 vs analyst estimates of $0.16 (10.1% beat)
- Adjusted Operating Income: $19.36 million vs analyst estimates of $17.61 million (15.2% margin, 9.9% beat)
- The company lifted its revenue guidance for the full year to $508.5 million at the midpoint from $502.5 million, a 1.2% increase
- Management reiterated its full-year Adjusted EPS guidance of $0.69 at the midpoint
- Operating Margin: -20.4%, down from -18.6% in the same quarter last year
- Free Cash Flow Margin: 27.9%, up from 23% in the previous quarter
- Customers: 1,076 customers paying more than $100,000 annually
- Net Revenue Retention Rate: 118%, up from 116% in the previous quarter
- Billings: $149 million at quarter end, up 31.7% year on year
- Market Capitalization: $4.81 billion
“With a unified focus on DevOps, Security, and MLOps, JFrog has positioned itself as a system of record for all software packages, and a leader in the fast-growing AI ecosystem as a gold-standard model registry,” said Shlomi Ben Haim, CEO, JFrog.
Company Overview
Named after the founders' affinity for frogs, JFrog (NASDAQ: FROG) provides a software-as-a-service platform that makes developing and releasing software easier and faster, especially for large teams.
Revenue Growth
Examining a company’s long-term performance can provide clues about its quality. Any business can experience short-term success, but top-performing ones enjoy sustained growth for years. Luckily, JFrog’s sales grew at a solid 24.8% compounded annual growth rate over the last three years. Its growth beat the average software company and shows its offerings resonate with customers.
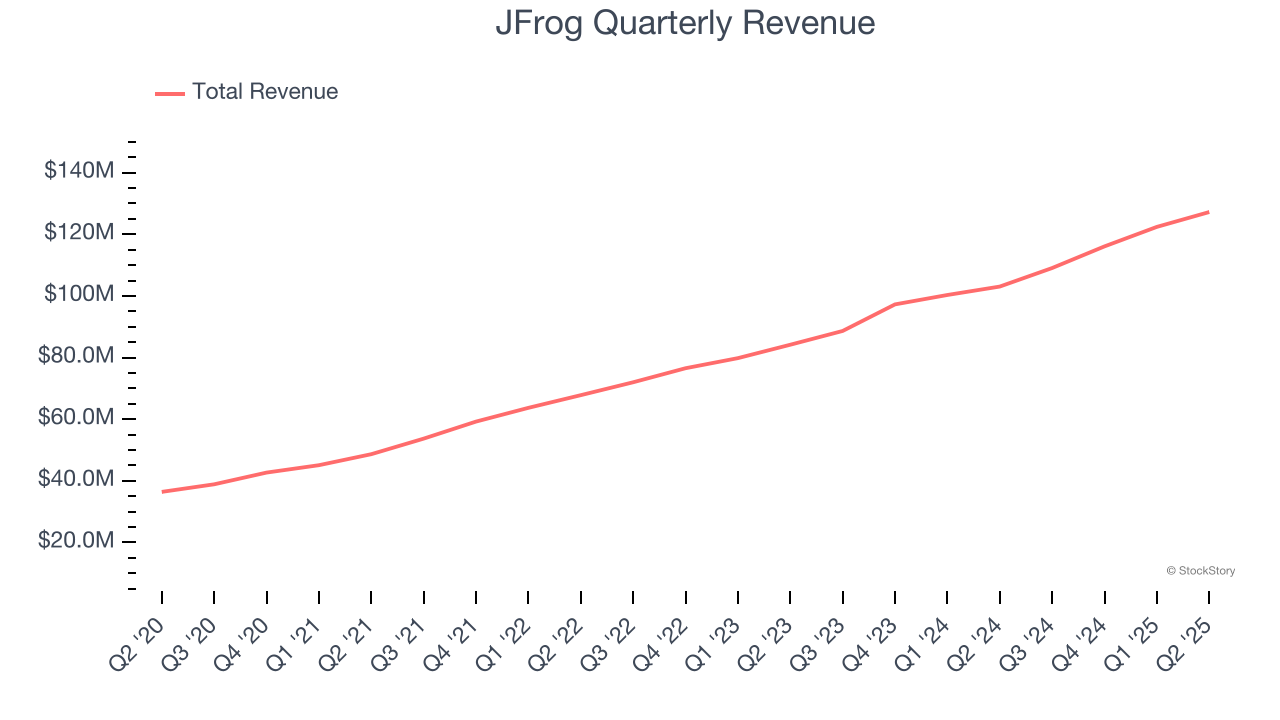
This quarter, JFrog reported robust year-on-year revenue growth of 23.5%, and its $127.2 million of revenue topped Wall Street estimates by 3.5%. Company management is currently guiding for a 17.4% year-on-year increase in sales next quarter.
Looking further ahead, sell-side analysts expect revenue to grow 13.3% over the next 12 months, a deceleration versus the last three years. Still, this projection is healthy and implies the market sees success for its products and services.
Unless you’ve been living under a rock, it should be obvious by now that generative AI is going to have a huge impact on how large corporations do business. While Nvidia and AMD are trading close to all-time highs, we prefer a lesser-known (but still profitable) stock benefiting from the rise of AI. Click here to access our free report one of our favorites growth stories.
Billings
Billings is a non-GAAP metric that is often called “cash revenue” because it shows how much money the company has collected from customers in a certain period. This is different from revenue, which must be recognized in pieces over the length of a contract.
JFrog’s billings punched in at $149 million in Q2, and over the last four quarters, its growth was fantastic as it averaged 29.6% year-on-year increases. This alternate topline metric grew faster than total sales, meaning the company collects cash upfront and then recognizes the revenue over the length of its contracts - a boost for its liquidity and future revenue prospects. 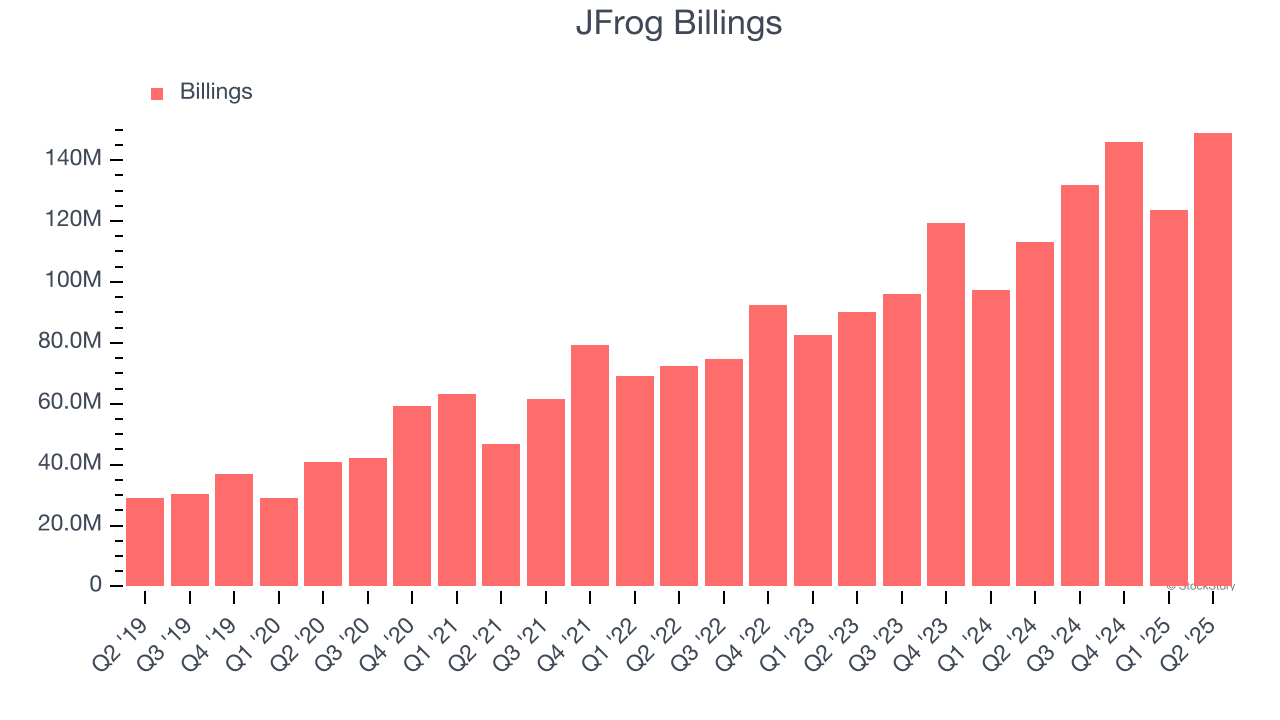
Customer Retention
One of the best parts about the software-as-a-service business model (and a reason why they trade at high valuation multiples) is that customers typically spend more on a company’s products and services over time.
JFrog’s net revenue retention rate, a key performance metric measuring how much money existing customers from a year ago are spending today, was 117% in Q2. This means JFrog would’ve grown its revenue by 16.7% even if it didn’t win any new customers over the last 12 months.
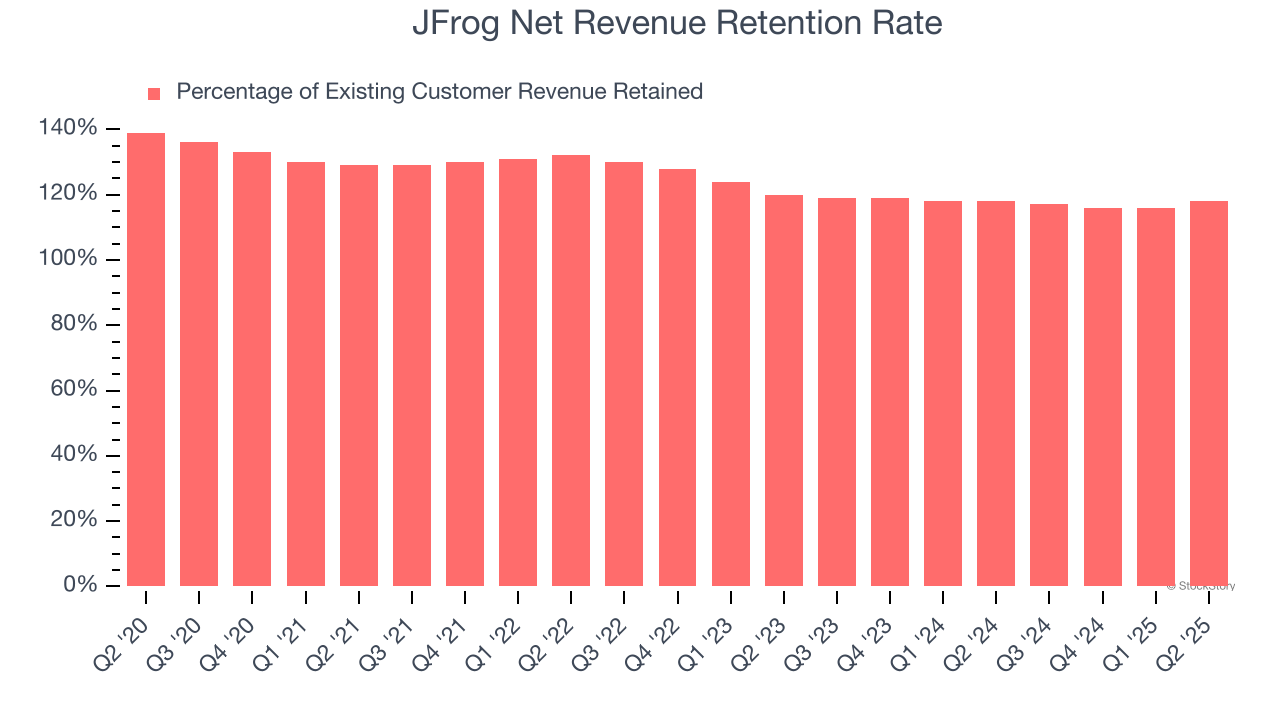
JFrog has a good net retention rate, proving that customers are satisfied with its software and getting more value from it over time, which is always great to see.
Key Takeaways from JFrog’s Q2 Results
We were impressed by how significantly JFrog blew past analysts’ billings, EPS, and EBITDA expectations this quarter. We were also happy it lifted its full-year revenue guidance. On the other hand, its full-year EPS guidance fell slightly short of Wall Street’s estimates, but we still think this print had some key positives. The stock traded up 14% to $44.27 immediately following the results.
So do we think JFrog is an attractive buy at the current price? What happened in the latest quarter matters, but not as much as longer-term business quality and valuation, when deciding whether to invest in this stock. We cover that in our actionable full research report which you can read here, it’s free.


