Network chips maker MACOM Technology Solutions (NASDAQ: MTSI) beat Wall Street’s revenue expectations in Q2 CY2025, with sales up 32.3% year on year to $252.1 million. Guidance for next quarter’s revenue was optimistic at $260 million at the midpoint, 2.3% above analysts’ estimates. Its non-GAAP profit of $0.90 per share was in line with analysts’ consensus estimates.
Is now the time to buy MACOM? Find out by accessing our full research report, it’s free.
MACOM (MTSI) Q2 CY2025 Highlights:
- Revenue: $252.1 million vs analyst estimates of $249.7 million (32.3% year-on-year growth, 1% beat)
- Adjusted EPS: $0.90 vs analyst estimates of $0.90 (in line)
- Adjusted EBITDA: $70.37 million vs analyst estimates of $72.99 million (27.9% margin, 3.6% miss)
- Revenue Guidance for Q3 CY2025 is $260 million at the midpoint, above analyst estimates of $254.2 million
- Adjusted EPS guidance for Q3 CY2025 is $0.93 at the midpoint, roughly in line with what analysts were expecting
- Operating Margin: 14.9%, up from 10.4% in the same quarter last year
- Free Cash Flow Margin: 20.5%, down from 21.8% in the same quarter last year
- Inventory Days Outstanding: 174, down from 180 in the previous quarter
- Market Capitalization: $10.34 billion
“Our team did a great job this quarter,” said Stephen G. Daly, President and Chief Executive Officer, MACOM.
Company Overview
Founded in the 1950s as Microwave Associates, a communications supplier to the US Army Signal Corp, today MACOM Technology Solutions (NASDAQ: MTSI) is a provider of analog chips used in optical, wireless, and satellite networks.
Revenue Growth
A company’s long-term sales performance is one signal of its overall quality. Any business can experience short-term success, but top-performing ones enjoy sustained growth for years. Luckily, MACOM’s sales grew at an impressive 12.9% compounded annual growth rate over the last five years. Its growth beat the average semiconductor company and shows its offerings resonate with customers, a helpful starting point for our analysis. Semiconductors are a cyclical industry, and long-term investors should be prepared for periods of high growth followed by periods of revenue contractions.
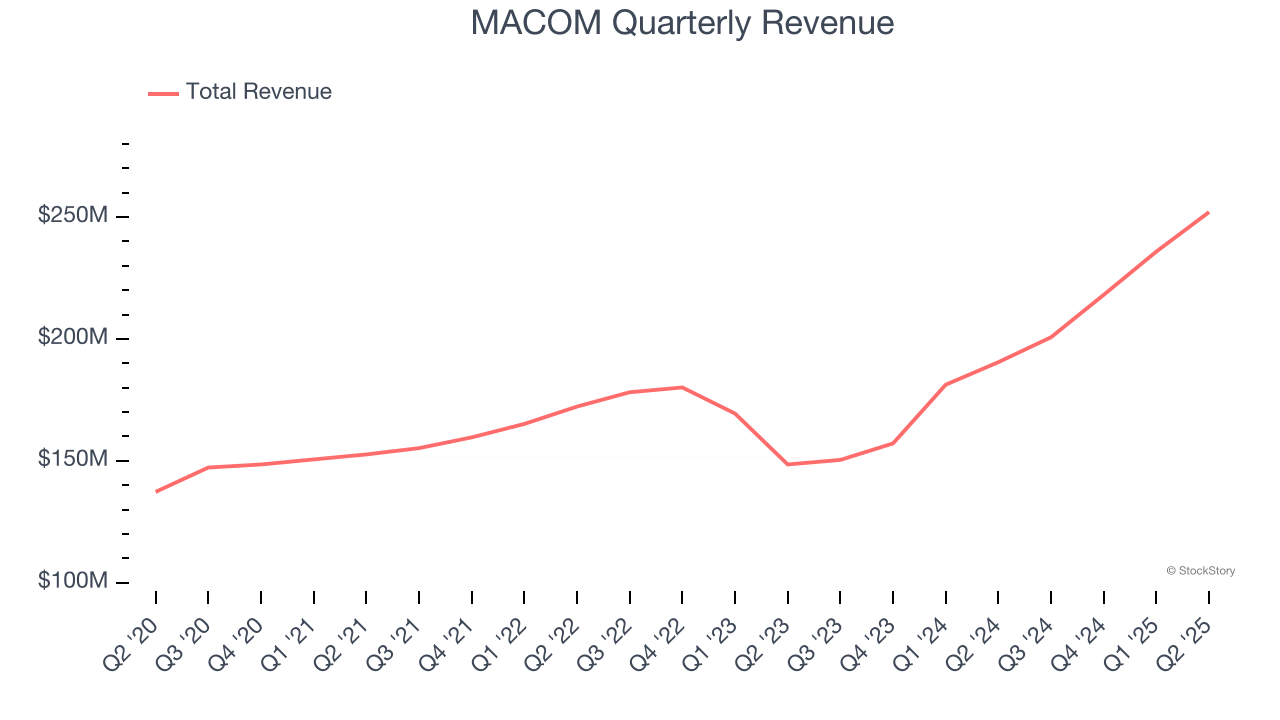
Long-term growth is the most important, but short-term results matter for semiconductors because the rapid pace of technological innovation (Moore's Law) could make yesterday's hit product obsolete today. MACOM’s annualized revenue growth of 15.8% over the last two years is above its five-year trend, suggesting its demand was strong and recently accelerated. 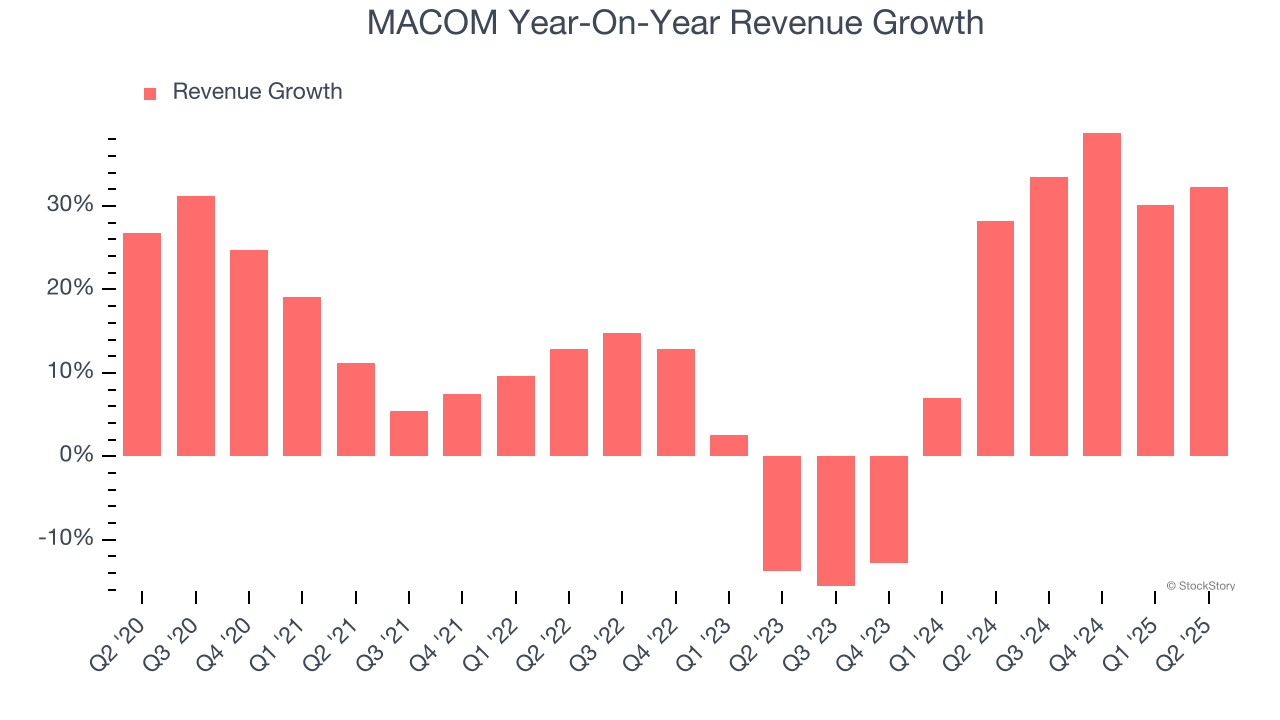
This quarter, MACOM reported wonderful year-on-year revenue growth of 32.3%, and its $252.1 million of revenue exceeded Wall Street’s estimates by 1%. Beyond the beat, this marks 6 straight quarters of growth, showing that the current upcycle has had a good run - a typical upcycle usually lasts 8-10 quarters. Company management is currently guiding for a 29.5% year-on-year increase in sales next quarter.
Looking further ahead, sell-side analysts expect revenue to grow 15.8% over the next 12 months, similar to its two-year rate. This projection is commendable and suggests the market is forecasting success for its products and services.
Software is eating the world and there is virtually no industry left that has been untouched by it. That drives increasing demand for tools helping software developers do their jobs, whether it be monitoring critical cloud infrastructure, integrating audio and video functionality, or ensuring smooth content streaming. Click here to access a free report on our 3 favorite stocks to play this generational megatrend.
Product Demand & Outstanding Inventory
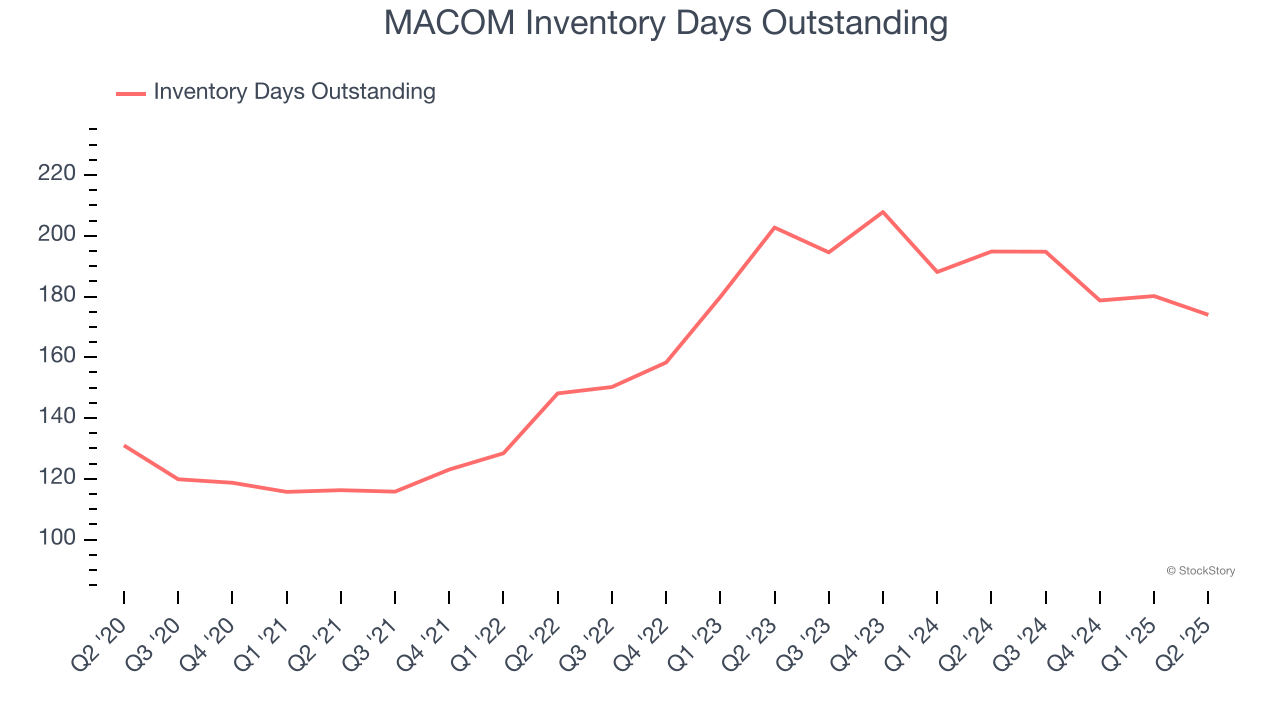
Days Inventory Outstanding (DIO) is an important metric for chipmakers, as it reflects a business’ capital intensity and the cyclical nature of semiconductor supply and demand. In a tight supply environment, inventories tend to be stable, allowing chipmakers to exert pricing power. Steadily increasing DIO can be a warning sign that demand is weak, and if inventories continue to rise, the company may have to downsize production.
This quarter, MACOM’s DIO came in at 174, which is 15 days above its five-year average. These numbers suggest that despite the recent decrease, the company’s inventory levels are higher than what we’ve seen in the past.
Key Takeaways from MACOM’s Q2 Results
It was encouraging to see MACOM’s revenue guidance for next quarter beat analysts’ expectations. We were also glad its inventory levels shrunk. On the other hand, its EBITDA missed. Overall, this print had some key positives. Investors were likely hoping for more, and shares traded down 8.5% to $127.35 immediately following the results.
Is MACOM an attractive investment opportunity at the current price? What happened in the latest quarter matters, but not as much as longer-term business quality and valuation, when deciding whether to invest in this stock. We cover that in our actionable full research report which you can read here, it’s free.