Semiconductor quality control company Nova (NASDAQ: NVMI) reported Q2 CY2025 results topping the market’s revenue expectations, with sales up 40.2% year on year to $220 million. Guidance for next quarter’s revenue was optimistic at $221 million at the midpoint, 2.4% above analysts’ estimates. Its non-GAAP profit of $2.20 per share was 6.5% above analysts’ consensus estimates.
Is now the time to buy Nova? Find out by accessing our full research report, it’s free.
Nova (NVMI) Q2 CY2025 Highlights:
- Revenue: $220 million vs analyst estimates of $214.9 million (40.2% year-on-year growth, 2.4% beat)
- Adjusted EPS: $2.20 vs analyst estimates of $2.06 (6.5% beat)
- Adjusted Operating Income: $75.04 million vs analyst estimates of $68.92 million (34.1% margin, 8.9% beat)
- Revenue Guidance for Q3 CY2025 is $221 million at the midpoint, above analyst estimates of $215.8 million
- Adjusted EPS guidance for Q3 CY2025 is $2.12 at the midpoint, above analyst estimates of $2.08
- Operating Margin: 29.8%, in line with the same quarter last year
- Free Cash Flow Margin: 19.5%, down from 36.9% in the same quarter last year
- Inventory Days Outstanding: 179, up from 177 in the previous quarter
- Market Capitalization: $7.58 billion
"We are proud to report another quarter of record revenue, with top-line performance landing at the high end of our guidance range and earnings results that meaningfully outpaced our profit outlook," said Gaby Waisman, President and CEO.
Company Overview
Headquartered in Israel, Nova (NASDAQ: NVMI) is a provider of quality control systems used in semiconductor manufacturing.
Revenue Growth
A company’s long-term sales performance can indicate its overall quality. Any business can have short-term success, but a top-tier one grows for years. Over the last five years, Nova grew its sales at an incredible 27.4% compounded annual growth rate. Its growth surpassed the average semiconductor company and shows its offerings resonate with customers, a great starting point for our analysis. Semiconductors are a cyclical industry, and long-term investors should be prepared for periods of high growth followed by periods of revenue contractions (which can sometimes offer opportune times to buy).
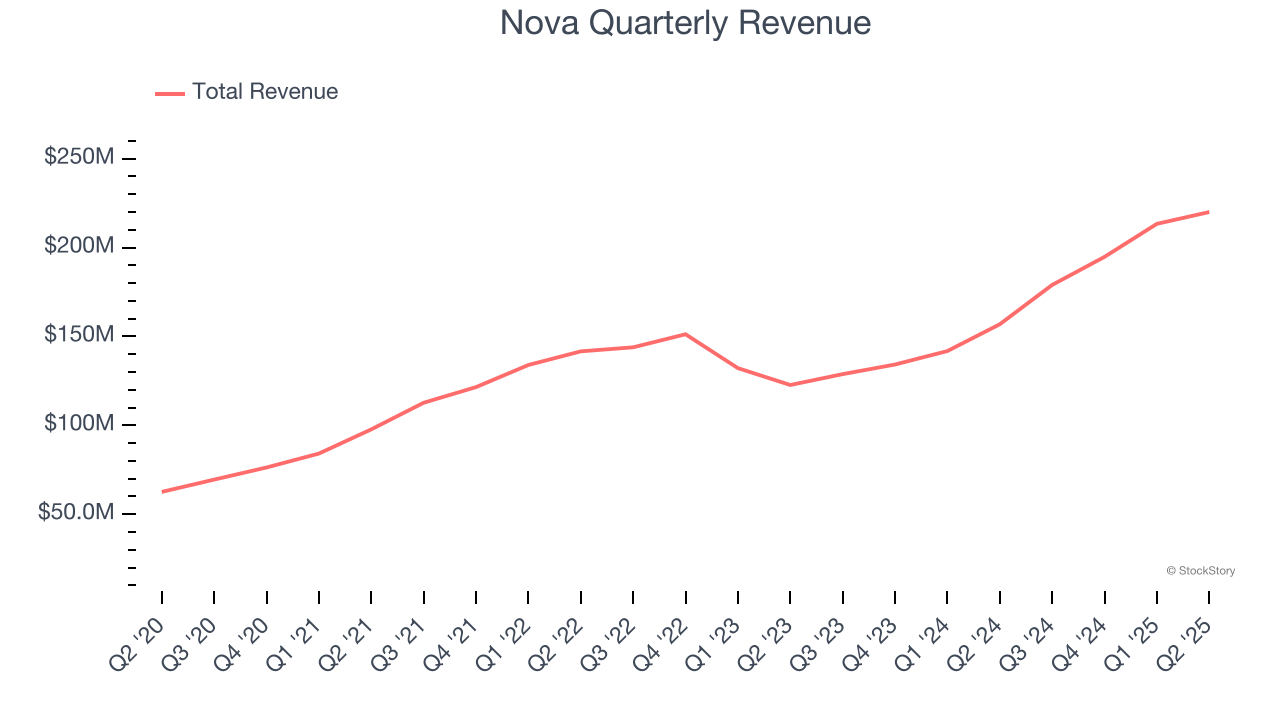
We at StockStory place the most emphasis on long-term growth, but within semiconductors, a half-decade historical view may miss new demand cycles or industry trends like AI. Nova’s annualized revenue growth of 21.1% over the last two years is below its five-year trend, but we still think the results suggest healthy demand. 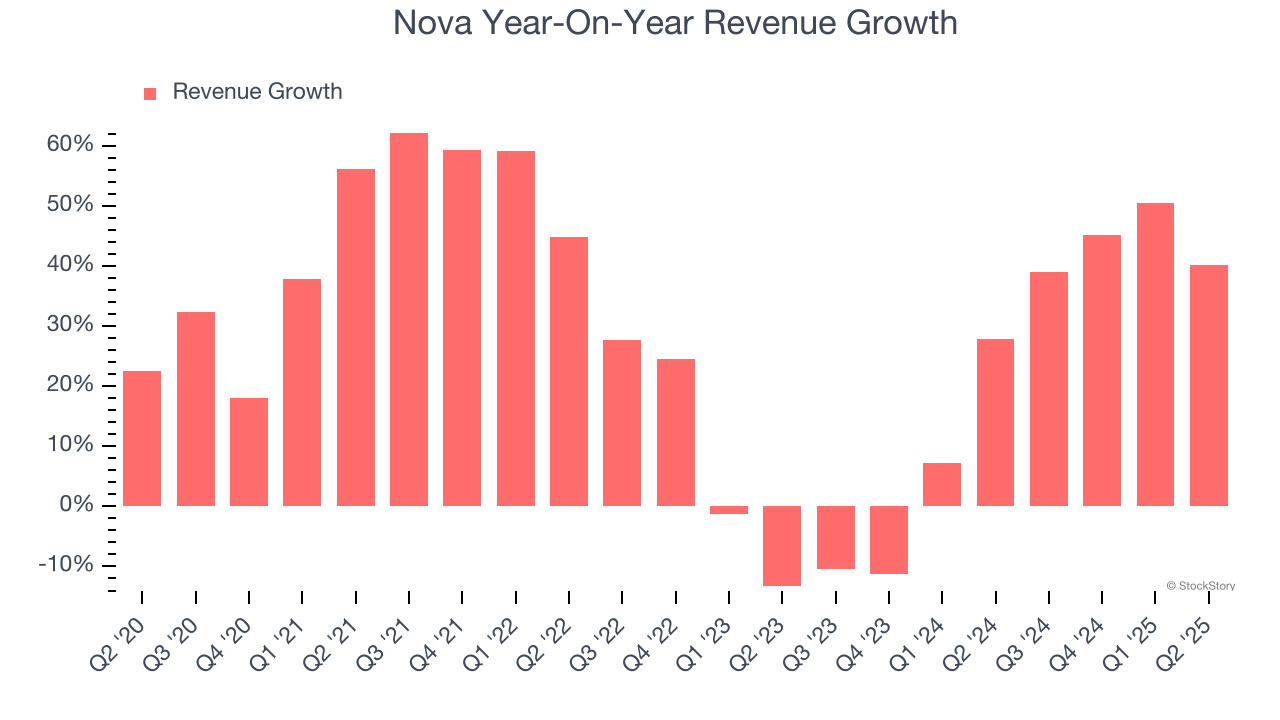
This quarter, Nova reported magnificent year-on-year revenue growth of 40.2%, and its $220 million of revenue beat Wall Street’s estimates by 2.4%. Beyond the beat, this marks 6 straight quarters of growth, showing that the current upcycle has had a good run - a typical upcycle usually lasts 8-10 quarters. Company management is currently guiding for a 23.5% year-on-year increase in sales next quarter.
Looking further ahead, sell-side analysts expect revenue to grow 8.7% over the next 12 months, a deceleration versus the last two years. Still, this projection is above the sector average and suggests the market is forecasting some success for its newer products and services.
Software is eating the world and there is virtually no industry left that has been untouched by it. That drives increasing demand for tools helping software developers do their jobs, whether it be monitoring critical cloud infrastructure, integrating audio and video functionality, or ensuring smooth content streaming. Click here to access a free report on our 3 favorite stocks to play this generational megatrend.
Product Demand & Outstanding Inventory
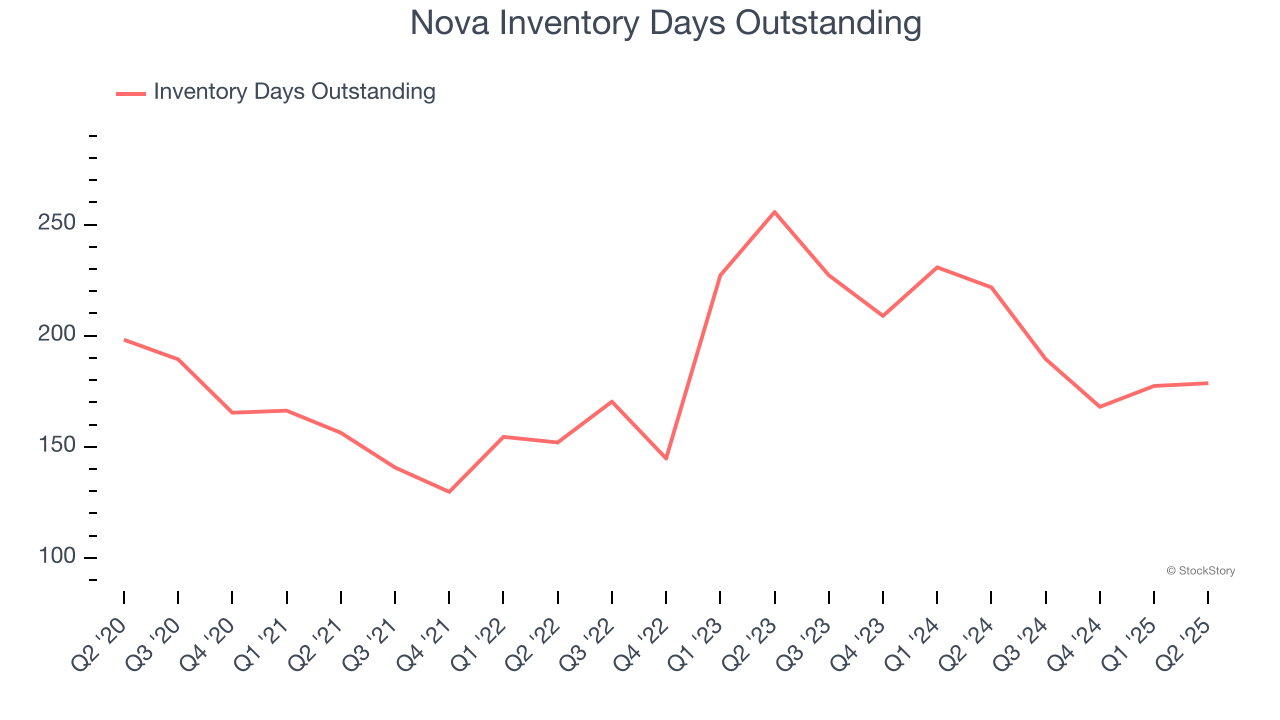
Days Inventory Outstanding (DIO) is an important metric for chipmakers, as it reflects a business’ capital intensity and the cyclical nature of semiconductor supply and demand. In a tight supply environment, inventories tend to be stable, allowing chipmakers to exert pricing power. Steadily increasing DIO can be a warning sign that demand is weak, and if inventories continue to rise, the company may have to downsize production.
This quarter, Nova’s DIO came in at 179, which is 4 days below its five-year average. These numbers show that despite the recent increase, there’s no indication of an excessive inventory buildup.
Key Takeaways from Nova’s Q2 Results
We were impressed by how significantly Nova blew past analysts’ adjusted operating income expectations this quarter. We were also glad its EPS outperformed Wall Street’s estimates. Zooming out, we think this was a solid print. The stock traded up 3.6% to $267.15 immediately following the results.
Nova put up rock-solid earnings, but one quarter doesn’t necessarily make the stock a buy. Let’s see if this is a good investment. The latest quarter does matter, but not nearly as much as longer-term fundamentals and valuation, when deciding if the stock is a buy. We cover that in our actionable full research report which you can read here, it’s free.