Hair care company Olaplex (NASDAQ: OLPX) reported Q2 CY2025 results topping the market’s revenue expectations, with sales up 2.3% year on year to $106.3 million. The company expects the full year’s revenue to be around $420.5 million, close to analysts’ estimates. Its GAAP loss of $0.01 per share was in line with analysts’ consensus estimates.
Is now the time to buy Olaplex? Find out by accessing our full research report, it’s free.
Olaplex (OLPX) Q2 CY2025 Highlights:
- Revenue: $106.3 million vs analyst estimates of $101.2 million (2.3% year-on-year growth, 5% beat)
- EPS (GAAP): -$0.01 vs analyst estimates of $0 (in line)
- Adjusted EBITDA: $24.55 million vs analyst estimates of $20.94 million (23.1% margin, 17.2% beat)
- The company reconfirmed its revenue guidance for the full year of $420.5 million at the midpoint
- Operating Margin: -1.1%, down from 15.7% in the same quarter last year
- Free Cash Flow Margin: 19.7%, up from 15.5% in the same quarter last year
- Market Capitalization: $939 million
Amanda Baldwin, OLAPLEX’s Chief Executive Officer, commented: "We delivered a solid first half of 2025. We remain in the midst of a multi-pronged transformation and are encouraged by the progress realized thus far. We are optimistic for the future as we continue to execute on our Bonds and Beyond strategy."
Company Overview
Rising to fame on TikTok because of its “bond building" hair products, Olaplex (NASDAQ: OLPX) offers products and treatments that repair the damage caused by traditional heat and chemical-based styling goods.
Revenue Growth
A company’s long-term performance is an indicator of its overall quality. Any business can experience short-term success, but top-performing ones enjoy sustained growth for years.
With $423.1 million in revenue over the past 12 months, Olaplex is a small consumer staples company, which sometimes brings disadvantages compared to larger competitors benefiting from economies of scale and negotiating leverage with retailers.
As you can see below, Olaplex struggled to generate demand over the last three years. Its sales dropped by 16.4% annually, a rough starting point for our analysis.
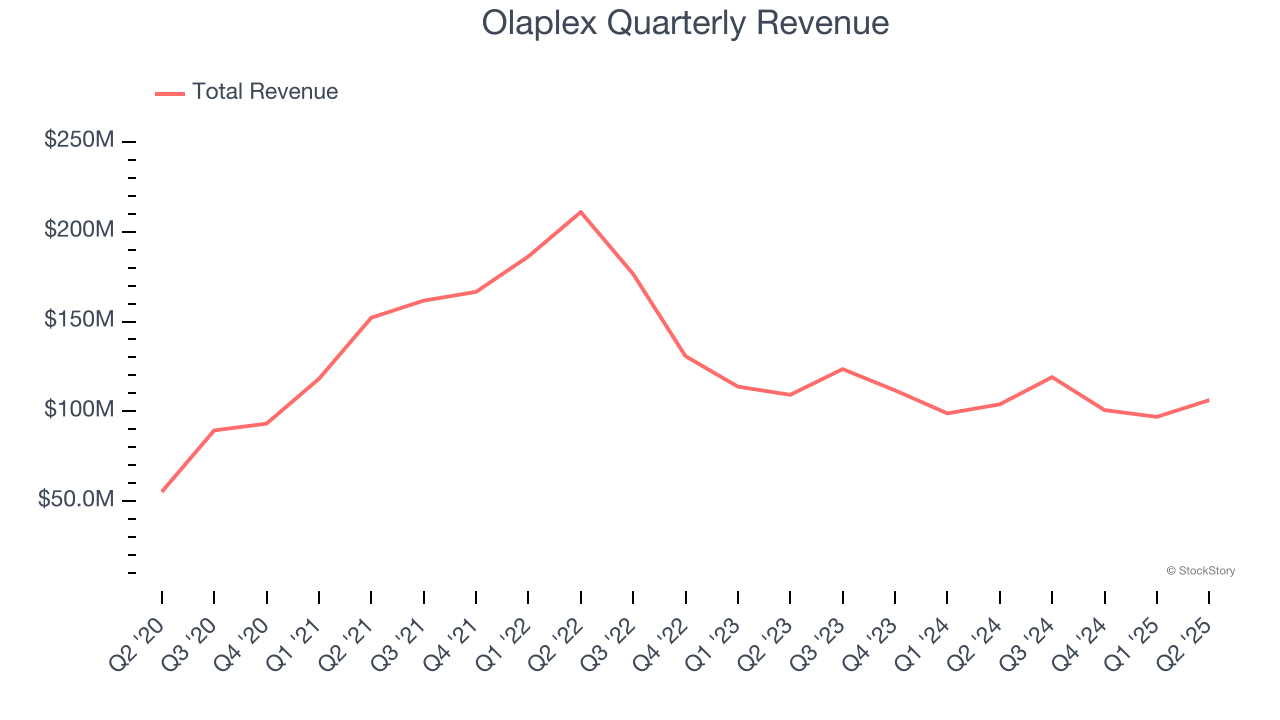
This quarter, Olaplex reported modest year-on-year revenue growth of 2.3% but beat Wall Street’s estimates by 5%.
Looking ahead, sell-side analysts expect revenue to grow 1.2% over the next 12 months. While this projection indicates its newer products will catalyze better top-line performance, it is still below average for the sector.
Unless you’ve been living under a rock, it should be obvious by now that generative AI is going to have a huge impact on how large corporations do business. While Nvidia and AMD are trading close to all-time highs, we prefer a lesser-known (but still profitable) stock benefiting from the rise of AI. Click here to access our free report one of our favorites growth stories.
Cash Is King
If you’ve followed StockStory for a while, you know we emphasize free cash flow. Why, you ask? We believe that in the end, cash is king, and you can’t use accounting profits to pay the bills.
Olaplex has shown terrific cash profitability, driven by its lucrative business model that enables it to reinvest, return capital to investors, and stay ahead of the competition. The company’s free cash flow margin was among the best in the consumer staples sector, averaging an eye-popping 30.4% over the last two years.
Taking a step back, we can see that Olaplex’s margin dropped by 13.1 percentage points over the last year. If its declines continue, it could signal increasing investment needs and capital intensity.
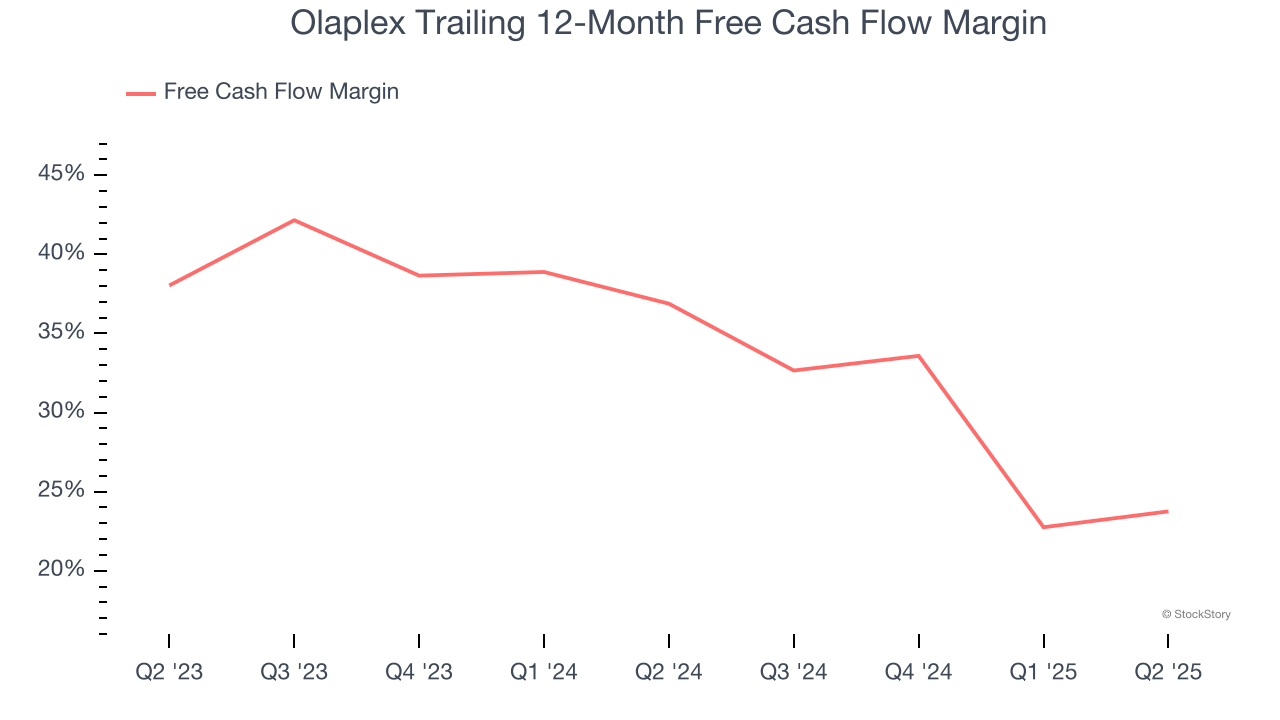
Olaplex’s free cash flow clocked in at $20.9 million in Q2, equivalent to a 19.7% margin. This result was good as its margin was 4.1 percentage points higher than in the same quarter last year, but we wouldn’t read too much into the short term because investment needs can be seasonal, leading to temporary swings. Long-term trends carry greater meaning.
Key Takeaways from Olaplex’s Q2 Results
We were impressed by how significantly Olaplex blew past analysts’ EBITDA expectations this quarter. We were also glad its revenue outperformed Wall Street’s estimates. On the other hand, its EPS missed. Overall, this print had some key positives. The stock traded up 2.5% to $1.44 immediately after reporting.
Should you buy the stock or not? We think that the latest quarter is only one piece of the longer-term business quality puzzle. Quality, when combined with valuation, can help determine if the stock is a buy. We cover that in our actionable full research report which you can read here, it’s free.