Fashion brand Ralph Lauren (NYSE: RL) reported Q2 CY2025 results beating Wall Street’s revenue expectations, with sales up 13.7% year on year to $1.72 billion. Its non-GAAP profit of $3.77 per share was 7.8% above analysts’ consensus estimates.
Is now the time to buy Ralph Lauren? Find out by accessing our full research report, it’s free.
Ralph Lauren (RL) Q2 CY2025 Highlights:
- Revenue: $1.72 billion vs analyst estimates of $1.66 billion (13.7% year-on-year growth, 3.6% beat)
- Adjusted EPS: $3.77 vs analyst estimates of $3.50 (7.8% beat)
- Adjusted EBITDA: $348.4 million vs analyst estimates of $328.4 million (20.3% margin, 6.1% beat)
- Operating Margin: 15.9%, up from 13.8% in the same quarter last year
- Free Cash Flow was -$11.2 million, down from $243.9 million in the same quarter last year
- Locations: 1,234 at quarter end, down from 1,262 in the same quarter last year
- Constant Currency Revenue rose 11.4% year on year (2.8% in the same quarter last year)
- Market Capitalization: $18.35 billion
"We delivered strong first quarter results across geographies, channels and consumer segments," said Patrice Louvet, President and Chief Executive Officer.
Company Overview
Originally founded as a necktie company, Ralph Lauren (NYSE: RL) is an iconic American fashion brand known for its classic and sophisticated style.
Revenue Growth
A company’s long-term performance is an indicator of its overall quality. Any business can put up a good quarter or two, but many enduring ones grow for years. Unfortunately, Ralph Lauren’s 6.9% annualized revenue growth over the last five years was sluggish. This fell short of our benchmark for the consumer discretionary sector and is a poor baseline for our analysis.
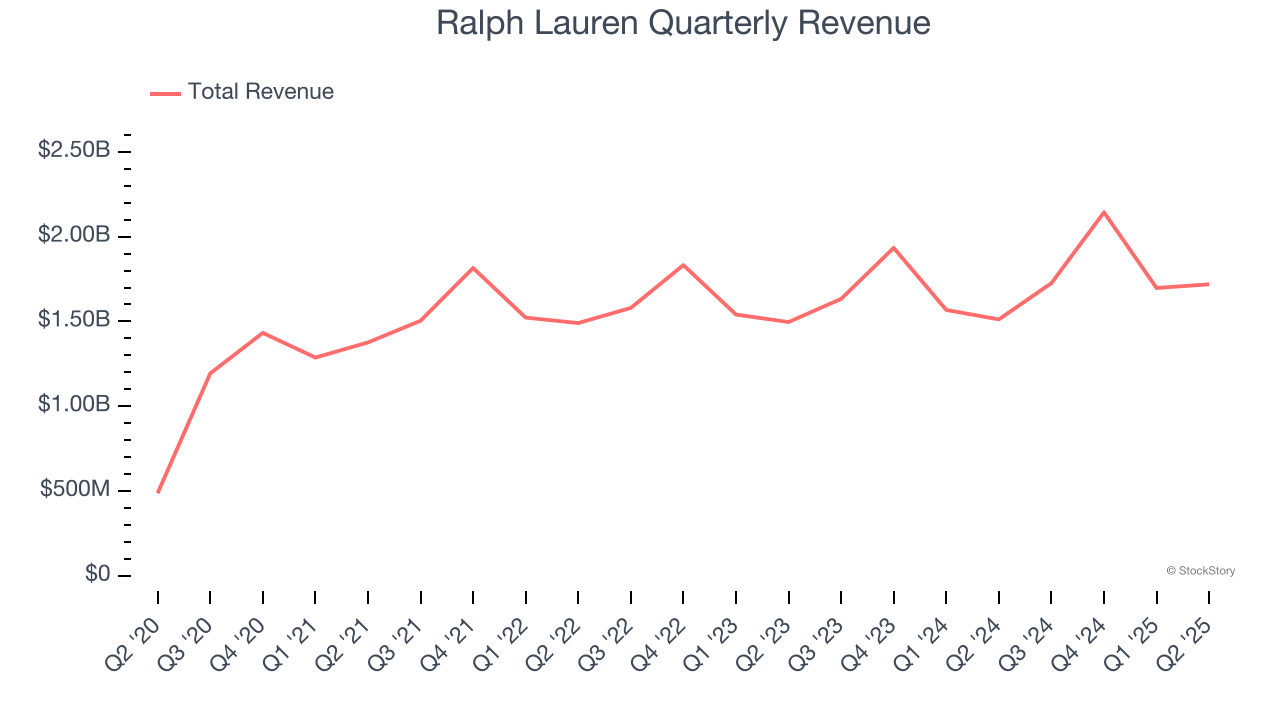
We at StockStory place the most emphasis on long-term growth, but within consumer discretionary, a stretched historical view may miss a company riding a successful new product or trend. Ralph Lauren’s annualized revenue growth of 6.3% over the last two years aligns with its five-year trend, suggesting its demand was consistently weak. 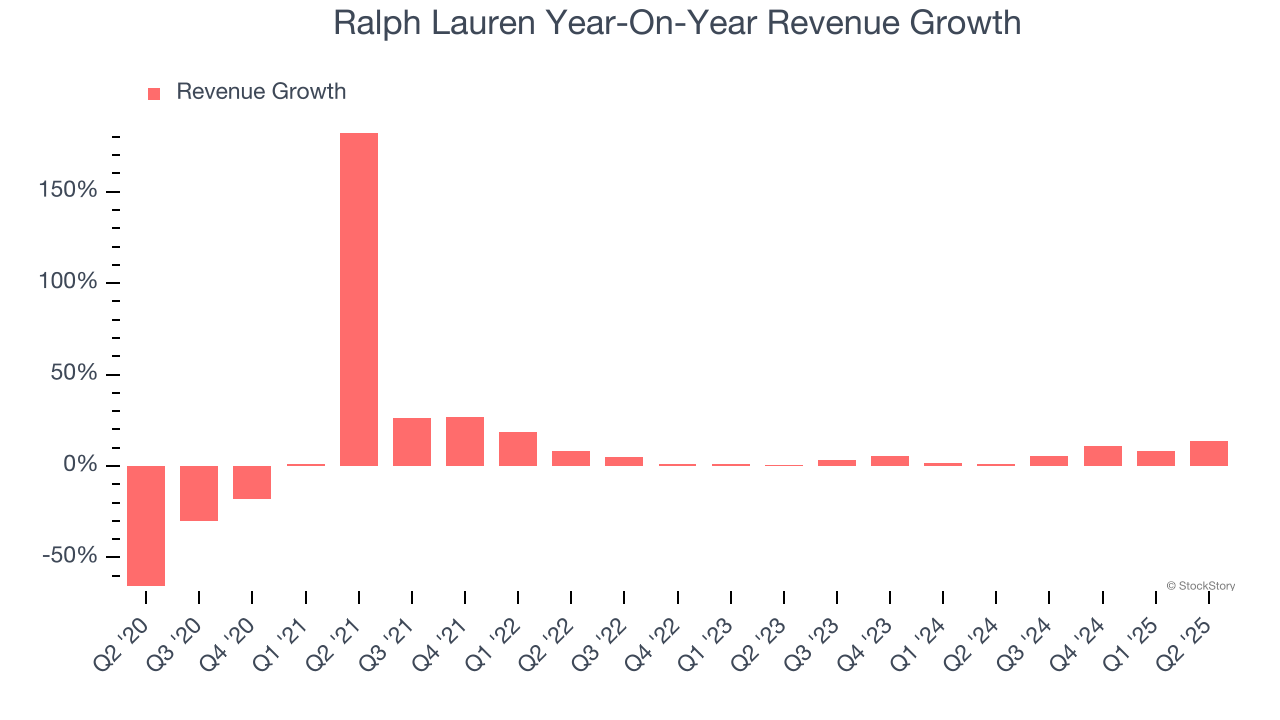
We can dig further into the company’s sales dynamics by analyzing its constant currency revenue, which excludes currency movements that are outside their control and not indicative of demand. Over the last two years, its constant currency sales averaged 6.3% year-on-year growth. Because this number aligns with its normal revenue growth, we can see that Ralph Lauren has properly hedged its foreign currency exposure. 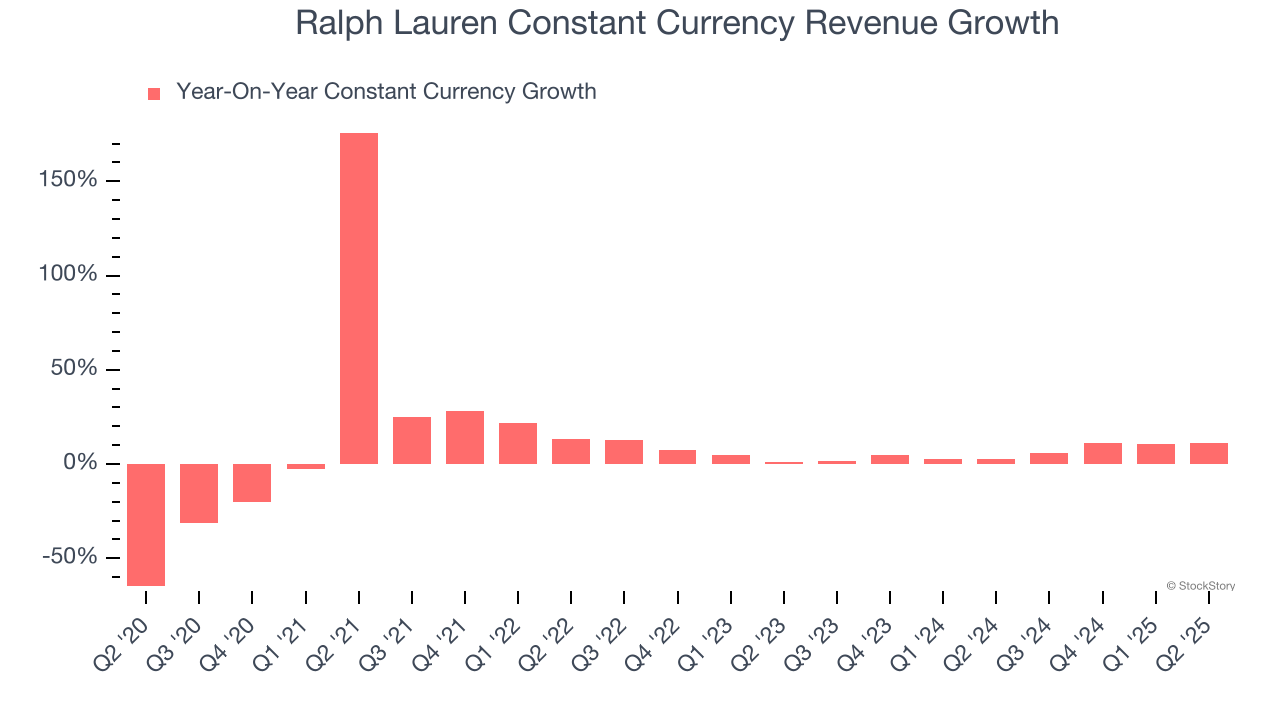
This quarter, Ralph Lauren reported year-on-year revenue growth of 13.7%, and its $1.72 billion of revenue exceeded Wall Street’s estimates by 3.6%.
Looking ahead, sell-side analysts expect revenue to grow 3.4% over the next 12 months, a slight deceleration versus the last two years. This projection doesn't excite us and suggests its products and services will face some demand challenges.
Software is eating the world and there is virtually no industry left that has been untouched by it. That drives increasing demand for tools helping software developers do their jobs, whether it be monitoring critical cloud infrastructure, integrating audio and video functionality, or ensuring smooth content streaming. Click here to access a free report on our 3 favorite stocks to play this generational megatrend.
Operating Margin
Ralph Lauren’s operating margin has been trending up over the last 12 months and averaged 12.9% over the last two years. Its profitability was higher than the broader consumer discretionary sector, showing it did a decent job managing its expenses.
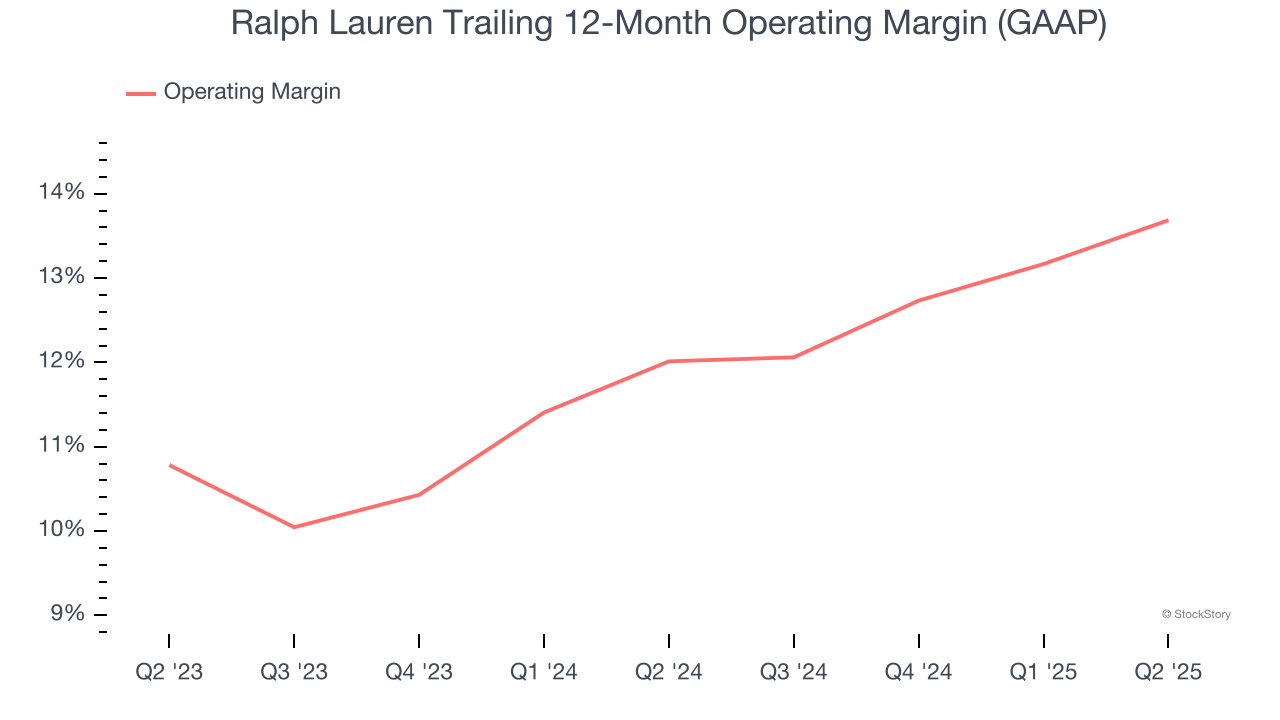
This quarter, Ralph Lauren generated an operating margin profit margin of 15.9%, up 2.1 percentage points year on year. This increase was a welcome development and shows it was more efficient.
Earnings Per Share
Revenue trends explain a company’s historical growth, but the long-term change in earnings per share (EPS) points to the profitability of that growth – for example, a company could inflate its sales through excessive spending on advertising and promotions.
Ralph Lauren’s EPS grew at an astounding 35.7% compounded annual growth rate over the last five years, higher than its 6.9% annualized revenue growth. This tells us the company became more profitable on a per-share basis as it expanded.
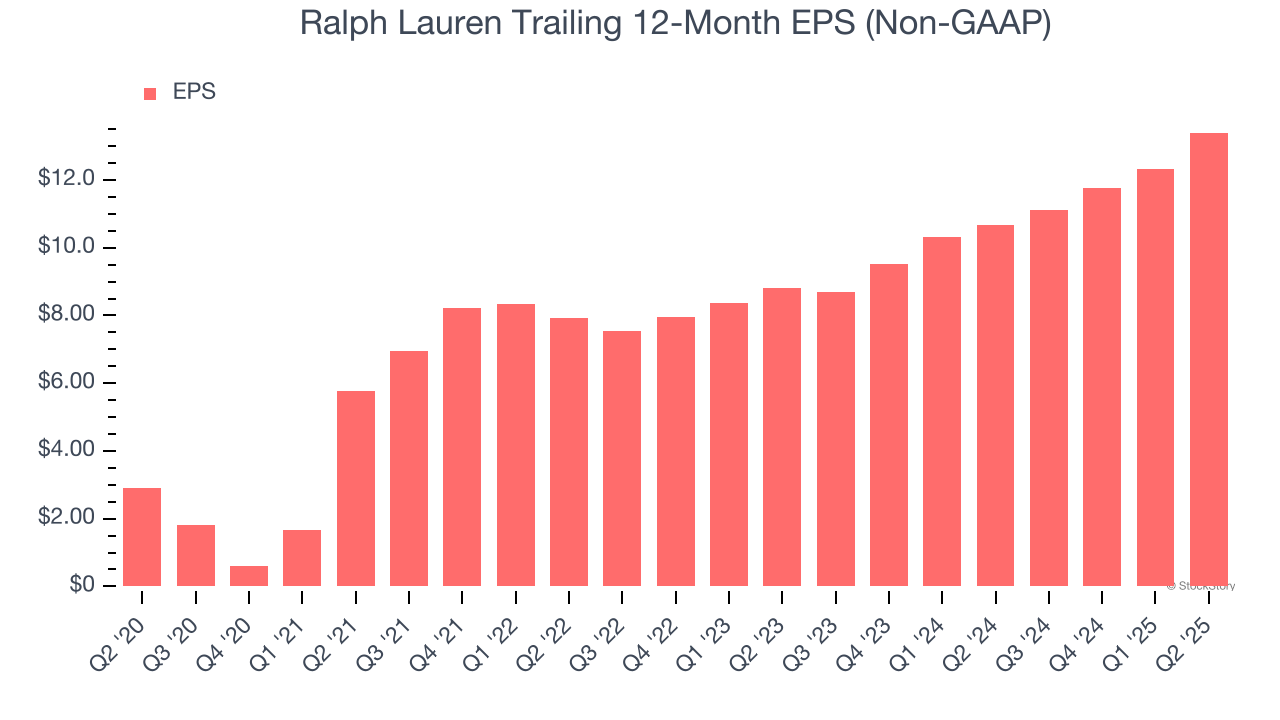
In Q2, Ralph Lauren reported adjusted EPS at $3.77, up from $2.70 in the same quarter last year. This print beat analysts’ estimates by 7.8%. Over the next 12 months, Wall Street expects Ralph Lauren’s full-year EPS of $13.40 to grow 6.4%.
Key Takeaways from Ralph Lauren’s Q2 Results
We were impressed by how significantly Ralph Lauren blew past analysts’ constant currency revenue expectations this quarter. We were also happy its EPS and EBITDA outperformed Wall Street’s estimates. Overall, we think this was a decent quarter with some key metrics above expectations. Investors were likely hoping for more, and shares traded down 6.8% to $282.24 immediately after reporting.
So should you invest in Ralph Lauren right now? We think that the latest quarter is only one piece of the longer-term business quality puzzle. Quality, when combined with valuation, can help determine if the stock is a buy. We cover that in our actionable full research report which you can read here, it’s free.