
Fast-food company Restaurant Brands (NYSE: QSR) reported Q2 CY2025 results topping the market’s revenue expectations, with sales up 15.9% year on year to $2.41 billion. Its non-GAAP profit of $0.94 per share was 2.8% below analysts’ consensus estimates.
Is now the time to buy Restaurant Brands? Find out by accessing our full research report, it’s free.
Restaurant Brands (QSR) Q2 CY2025 Highlights:
- Revenue: $2.41 billion vs analyst estimates of $2.34 billion (15.9% year-on-year growth, 2.9% beat)
- Adjusted EPS: $0.94 vs analyst expectations of $0.97 (2.8% miss)
- Operating Margin: 20%, down from 31.9% in the same quarter last year
- Free Cash Flow Margin: 17.1%, up from 14% in the same quarter last year
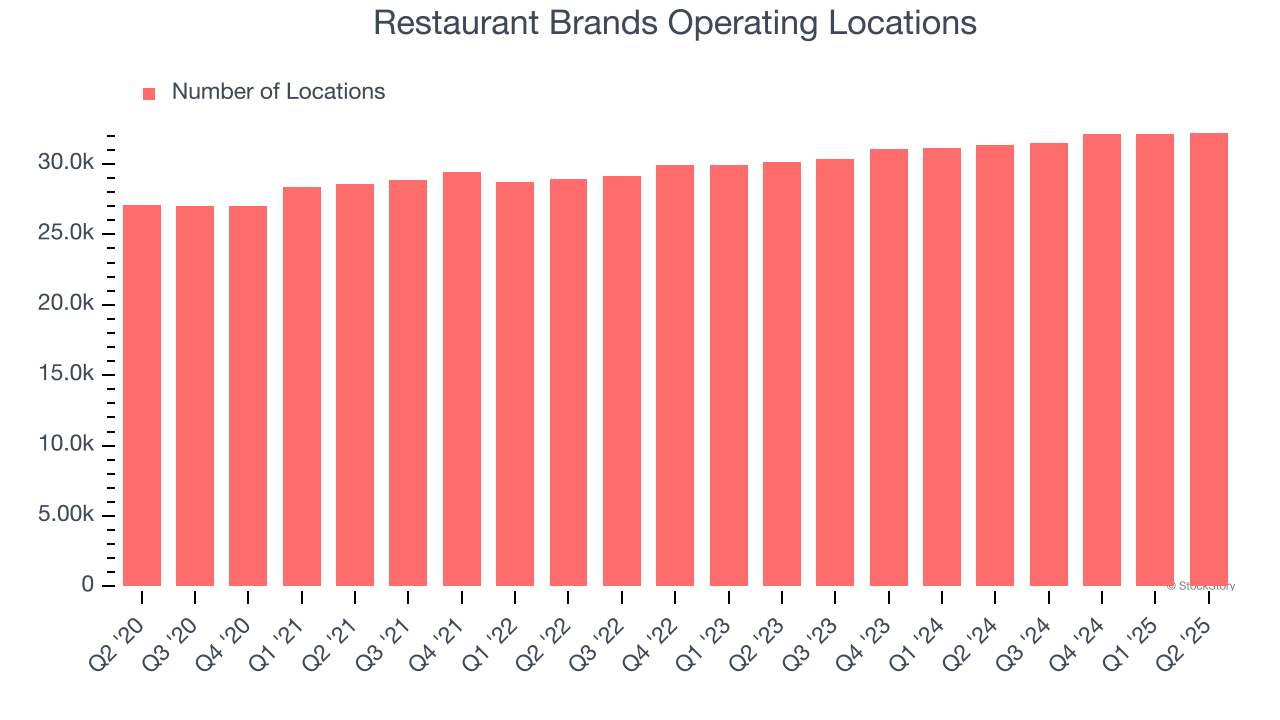
- Locations: 32,229 at quarter end, up from 31,324 in the same quarter last year
- Same-Store Sales rose 2.4% year on year, in line with the same quarter last year
- Market Capitalization: $22.48 billion
Company Overview
Formed through a strategic merger, Restaurant Brands International (NYSE: QSR) is a multinational corporation that owns three iconic fast-food chains: Burger King, Tim Hortons, and Popeyes.
Revenue Growth
Reviewing a company’s long-term sales performance reveals insights into its quality. Any business can experience short-term success, but top-performing ones enjoy sustained growth for years.
With $9.11 billion in revenue over the past 12 months, Restaurant Brands is one of the most widely recognized restaurant chains and benefits from customer loyalty, a luxury many don’t have. Its scale also gives it negotiating leverage with suppliers, enabling it to source its ingredients at a lower cost.
As you can see below, Restaurant Brands grew its sales at a decent 9% compounded annual growth rate over the last six years (we compare to 2019 to normalize for COVID-19 impacts) as it opened new restaurants and increased sales at existing, established dining locations.
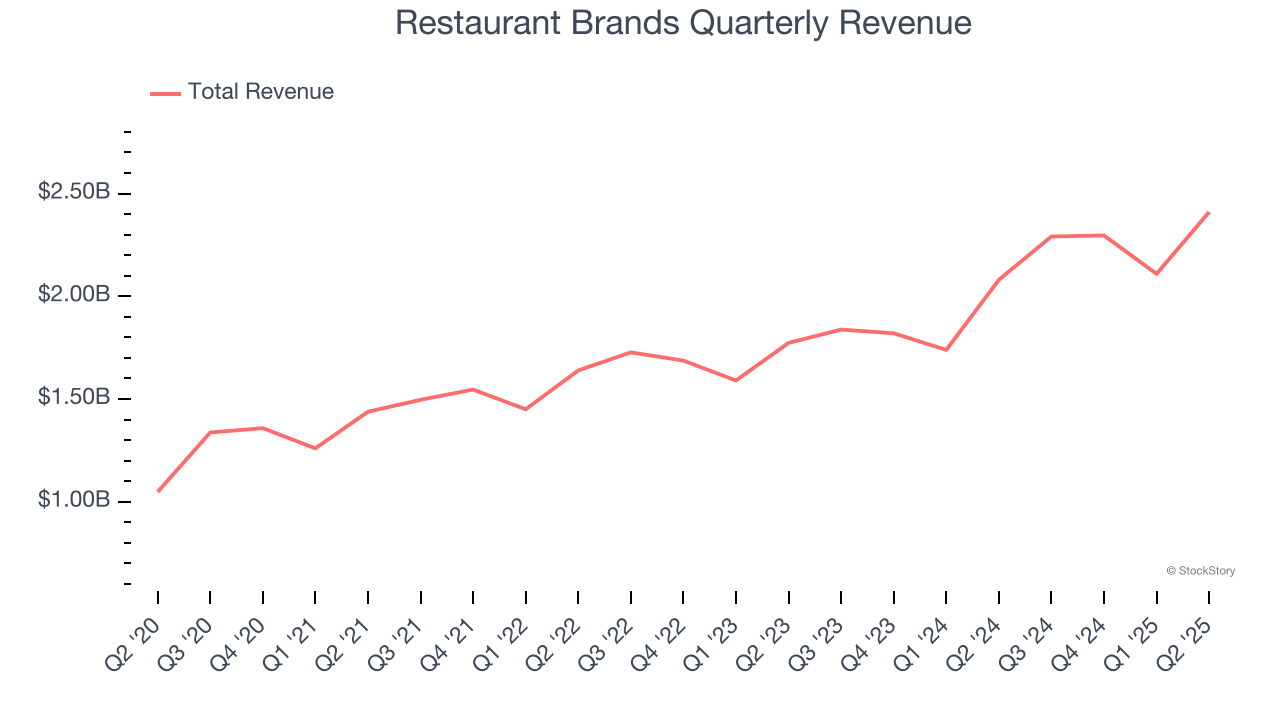
This quarter, Restaurant Brands reported year-on-year revenue growth of 15.9%, and its $2.41 billion of revenue exceeded Wall Street’s estimates by 2.9%.
Looking ahead, sell-side analysts expect revenue to grow 2.9% over the next 12 months, a deceleration versus the last six years. This projection is underwhelming and suggests its menu offerings will face some demand challenges.
Here at StockStory, we certainly understand the potential of thematic investing. Diverse winners from Microsoft (MSFT) to Alphabet (GOOG), Coca-Cola (KO) to Monster Beverage (MNST) could all have been identified as promising growth stories with a megatrend driving the growth. So, in that spirit, we’ve identified a relatively under-the-radar profitable growth stock benefiting from the rise of AI, available to you FREE via this link.
Restaurant Performance
Number of Restaurants
Restaurant Brands sported 32,229 locations in the latest quarter. Over the last two years, it has opened new restaurants at a rapid clip by averaging 3.7% annual growth, among the fastest in the restaurant sector. Additionally, one dynamic making expansion more seamless is the company’s franchise model, where franchisees are primarily responsible for opening new restaurants while Restaurant Brands provides support.
When a chain opens new restaurants, it usually means it’s investing for growth because there’s healthy demand for its meals and there are markets where its concepts have few or no locations.
Same-Store Sales
A company's restaurant base only paints one part of the picture. When demand is high, it makes sense to open more. But when demand is low, it’s prudent to close some locations and use the money in other ways. Same-store sales gives us insight into this topic because it measures organic growth at restaurants open for at least a year.
Restaurant Brands’s demand has been healthy for a restaurant chain over the last two years. On average, the company has grown its same-store sales by a robust 3.1% per year. This performance suggests its rollout of new restaurants could be beneficial for shareholders. When a chain has demand, more locations should help it reach more customers and boost revenue growth.
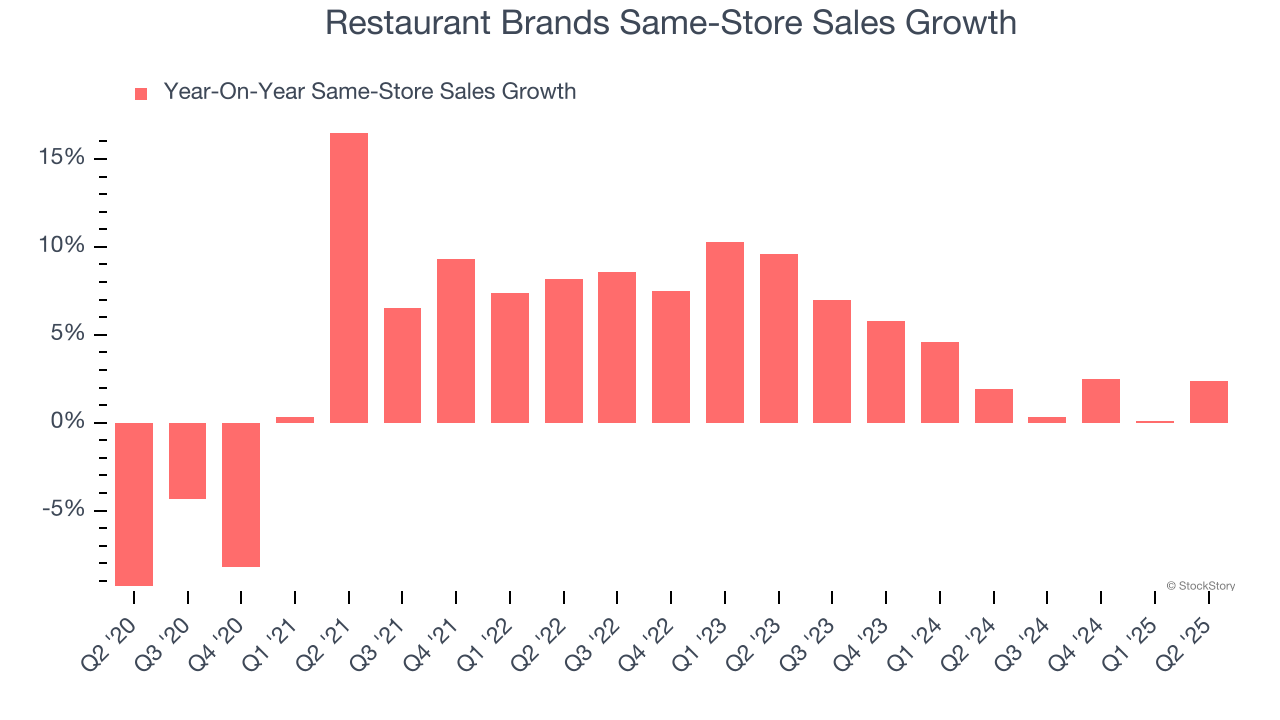
In the latest quarter, Restaurant Brands’s same-store sales rose 2.4% year on year. This performance was more or less in line with its historical levels.
Key Takeaways from Restaurant Brands’s Q2 Results
We enjoyed seeing Restaurant Brands beat analysts’ revenue expectations this quarter. We were also happy its same-store sales was in line with Wall Street’s estimates. On the other hand, its EPS slightly missed. Overall, this print was mixed. Investors were likely hoping for more, and shares traded down 4.9% to $65.22 immediately after reporting.
So do we think Restaurant Brands is an attractive buy at the current price? The latest quarter does matter, but not nearly as much as longer-term fundamentals and valuation, when deciding if the stock is a buy. We cover that in our actionable full research report which you can read here, it’s free.


