Casual salad chain Sweetgreen (NYSE: SG) missed Wall Street’s revenue expectations in Q2 CY2025, with sales flat year on year at $185.6 million. The company’s full-year revenue guidance of $707.5 million at the midpoint came in 4.4% below analysts’ estimates. Its GAAP loss of $0.20 per share was 64.3% below analysts’ consensus estimates.
Is now the time to buy Sweetgreen? Find out by accessing our full research report, it’s free.
Sweetgreen (SG) Q2 CY2025 Highlights:
- Revenue: $185.6 million vs analyst estimates of $191.8 million (flat year on year, 3.3% miss)
- EPS (GAAP): -$0.20 vs analyst expectations of -$0.12 (64.3% miss)
- Adjusted EBITDA: $6.42 million vs analyst estimates of $11.02 million (3.5% margin, 41.8% miss)
- The company dropped its revenue guidance for the full year to $707.5 million at the midpoint from $750 million, a 5.7% decrease
- EBITDA guidance for the full year is $12.5 million at the midpoint, below analyst estimates of $25.83 million
- Operating Margin: -14.2%, down from -8.8% in the same quarter last year
- Free Cash Flow was -$13.14 million compared to -$156,000 in the same quarter last year
- Same-Store Sales fell 7.6% year on year (9% in the same quarter last year)
- Market Capitalization: $1.45 billion
Company Overview
Founded in 2007 by three Georgetown University alum, Sweetgreen (NYSE: SG) is a casual quick service chain known for its healthy salads and bowls.
Revenue Growth
A company’s long-term sales performance is one signal of its overall quality. Even a bad business can shine for one or two quarters, but a top-tier one grows for years.
With $686.2 million in revenue over the past 12 months, Sweetgreen is a small restaurant chain, which sometimes brings disadvantages compared to larger competitors benefiting from better brand awareness and economies of scale. On the bright side, it can grow faster because it has more white space to build new restaurants.
As you can see below, Sweetgreen grew its sales at an excellent 17.9% compounded annual growth rate over the last six years (we compare to 2019 to normalize for COVID-19 impacts) as it opened new restaurants and increased sales at existing, established dining locations.
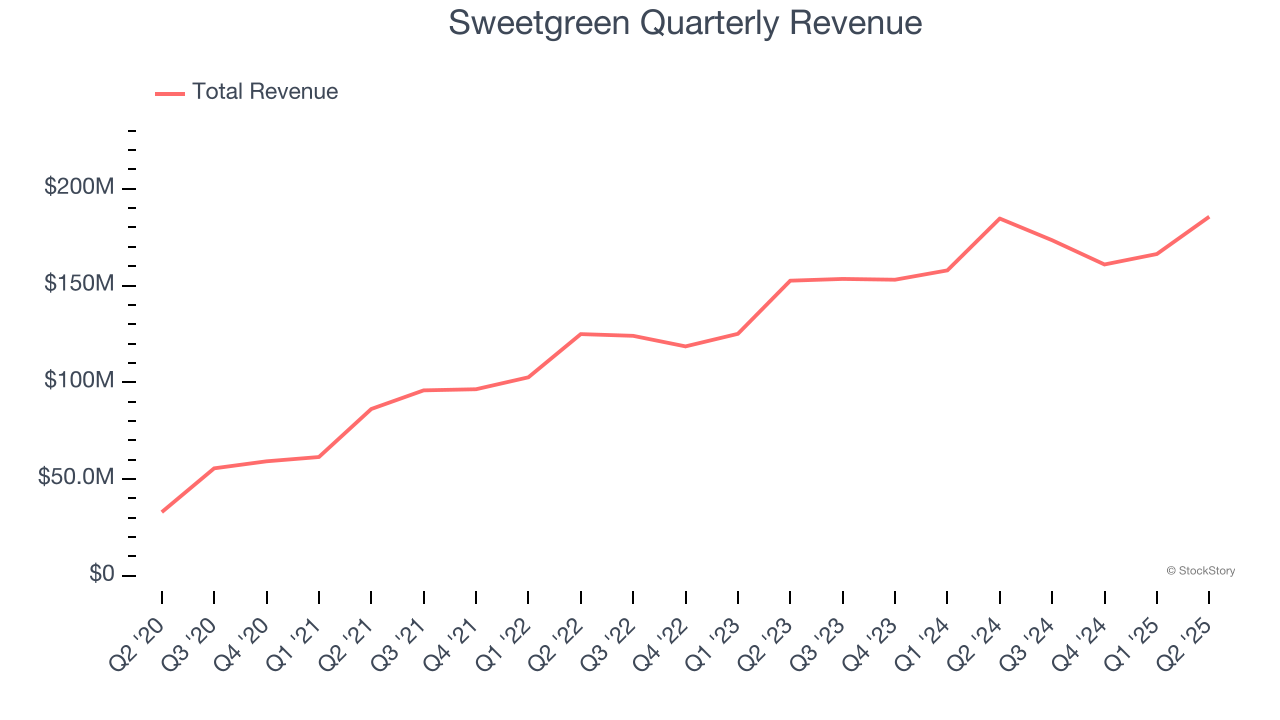
This quarter, Sweetgreen’s $185.6 million of revenue was flat year on year, falling short of Wall Street’s estimates.
Looking ahead, sell-side analysts expect revenue to grow 18.7% over the next 12 months, similar to its six-year rate. This projection is admirable and suggests the market is baking in success for its menu offerings.
Unless you’ve been living under a rock, it should be obvious by now that generative AI is going to have a huge impact on how large corporations do business. While Nvidia and AMD are trading close to all-time highs, we prefer a lesser-known (but still profitable) stock benefiting from the rise of AI. Click here to access our free report one of our favorites growth stories.
Restaurant Performance
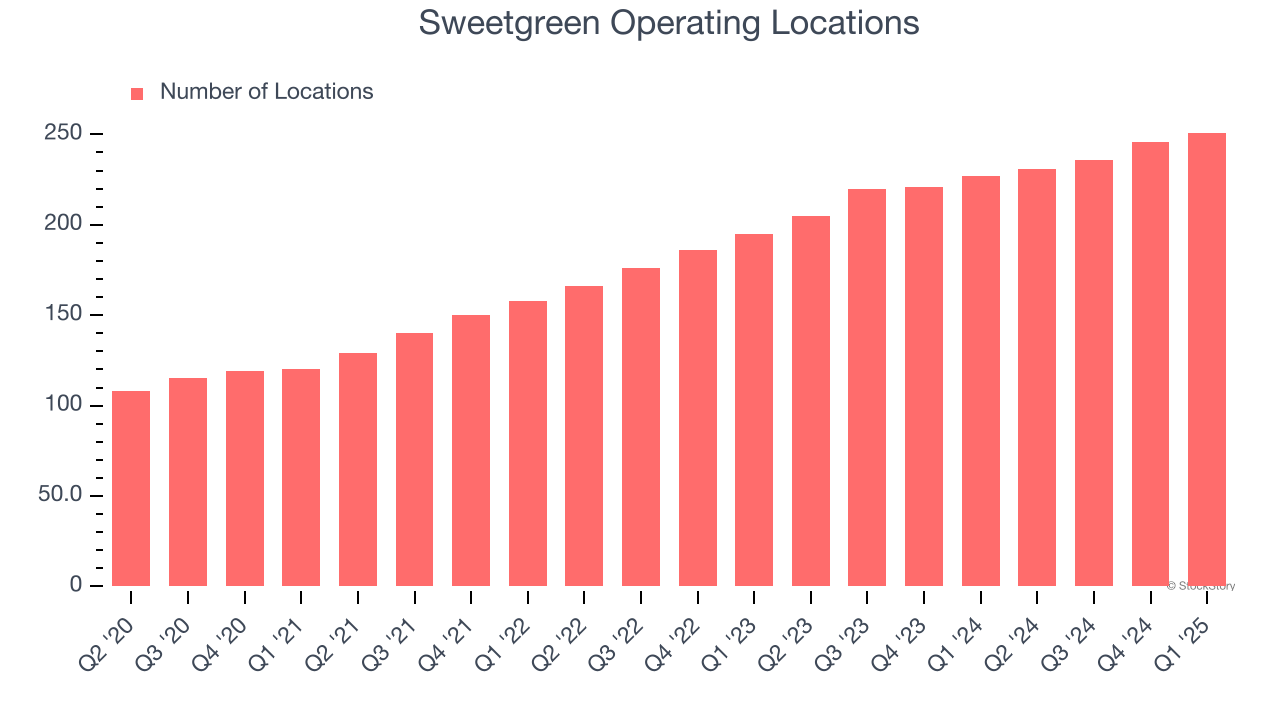
Number of Restaurants
The number of dining locations a restaurant chain operates is a critical driver of how quickly company-level sales can grow.
Over the last two years, Sweetgreen opened new restaurants at a rapid clip by averaging 14.6% annual growth, among the fastest in the restaurant sector. This gives it a chance to scale into a mid-sized business over time.
When a chain opens new restaurants, it usually means it’s investing for growth because there’s healthy demand for its meals and there are markets where its concepts have few or no locations.
Note that Sweetgreen reports its restaurant count intermittently, so some data points are missing in the chart below.
Same-Store Sales
A company's restaurant base only paints one part of the picture. When demand is high, it makes sense to open more. But when demand is low, it’s prudent to close some locations and use the money in other ways. Same-store sales provides a deeper understanding of this issue because it measures organic growth at restaurants open for at least a year.
Sweetgreen’s demand has been healthy for a restaurant chain over the last two years. On average, the company has grown its same-store sales by a robust 2.9% per year. This performance gives it the confidence to meaningfully expand its restaurant base.
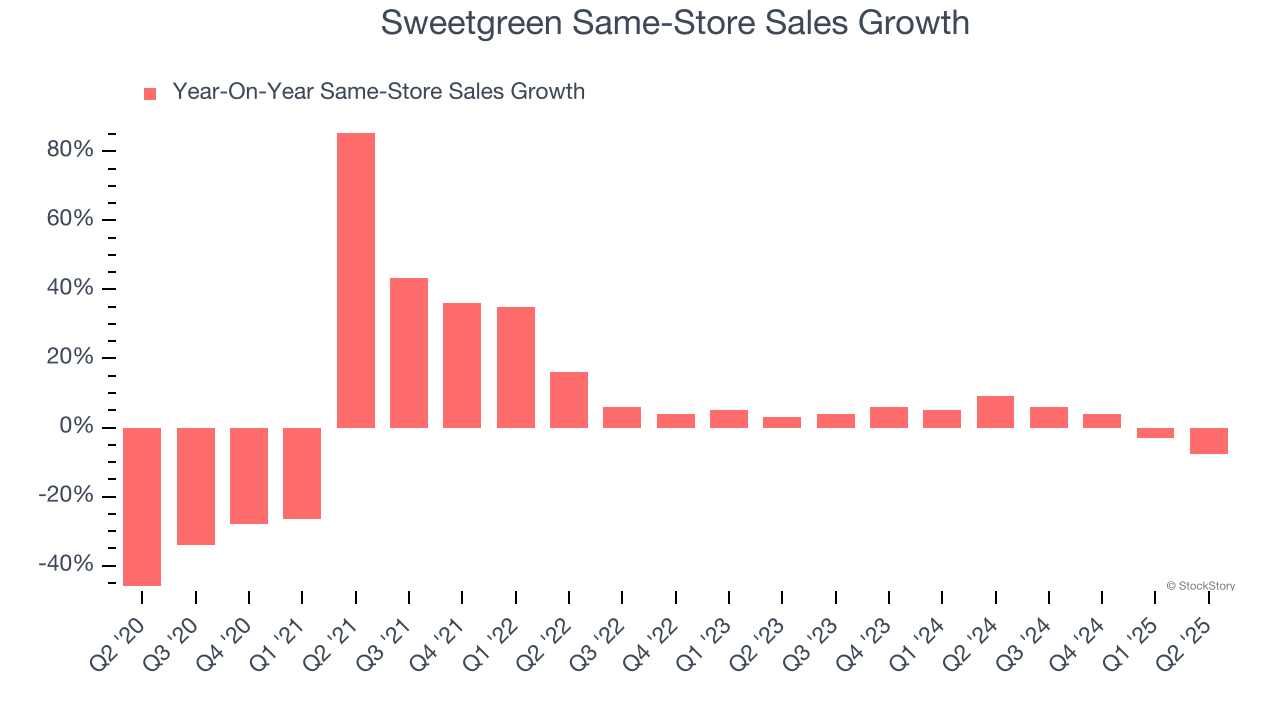
In the latest quarter, Sweetgreen’s same-store sales fell by 7.6% year on year. This decline was a reversal from its historical levels.
Key Takeaways from Sweetgreen’s Q2 Results
We struggled to find many positives in these results. It missed across the board and its full-year revenue and EBITDA guidance fell short of Wall Street’s estimates. Overall, this was a softer quarter. The stock traded down 23.3% to $9.70 immediately following the results.
Sweetgreen’s latest earnings report disappointed. One quarter doesn’t define a company’s quality, so let’s explore whether the stock is a buy at the current price. When making that decision, it’s important to consider its valuation, business qualities, as well as what has happened in the latest quarter. We cover that in our actionable full research report which you can read here, it’s free.