
Restaurant company Texas Roadhouse (NASDAQ: TXRH) beat Wall Street’s revenue expectations in Q2 CY2025, with sales up 12.7% year on year to $1.51 billion. Its GAAP profit of $1.86 per share was 2.8% below analysts’ consensus estimates.
Is now the time to buy Texas Roadhouse? Find out by accessing our full research report, it’s free.
Texas Roadhouse (TXRH) Q2 CY2025 Highlights:
- Revenue: $1.51 billion vs analyst estimates of $1.50 billion (12.7% year-on-year growth, 0.6% beat)
- EPS (GAAP): $1.86 vs analyst expectations of $1.91 (2.8% miss)
- Adjusted EBITDA: $197.1 million vs analyst estimates of $203.2 million (13% margin, 3% miss)
- Operating Margin: 9.7%, in line with the same quarter last year
- Free Cash Flow Margin: 2.4%, down from 4.2% in the same quarter last year
- Locations: 797 at quarter end, up from 762 in the same quarter last year
- Same-Store Sales rose 5.9% year on year (8.9% in the same quarter last year)
- Market Capitalization: $12.23 billion
Jerry Morgan, Chief Executive Officer of Texas Roadhouse, Inc., commented, “Our operators delivered another quarter of strong comparable restaurant sales growth driven by positive traffic across all three of our brands. While we expect commodity inflation to further impact our profitability for the rest of the year, we remain focused on what we can control— preserving our value proposition and maintaining a relentless focus on operational excellence across all our brands.”
Company Overview
With locations often featuring Western-inspired decor, Texas Roadhouse (NASDAQ: TXRH) is an American restaurant chain specializing in Southern-style cuisine and steaks.
Revenue Growth
A company’s long-term performance is an indicator of its overall quality. Any business can put up a good quarter or two, but many enduring ones grow for years.
With $5.67 billion in revenue over the past 12 months, Texas Roadhouse is one of the larger restaurant chains in the industry and benefits from a well-known brand that influences consumer purchasing decisions.
As you can see below, Texas Roadhouse’s sales grew at an impressive 14% compounded annual growth rate over the last six years (we compare to 2019 to normalize for COVID-19 impacts) as it opened new restaurants and increased sales at existing, established dining locations.
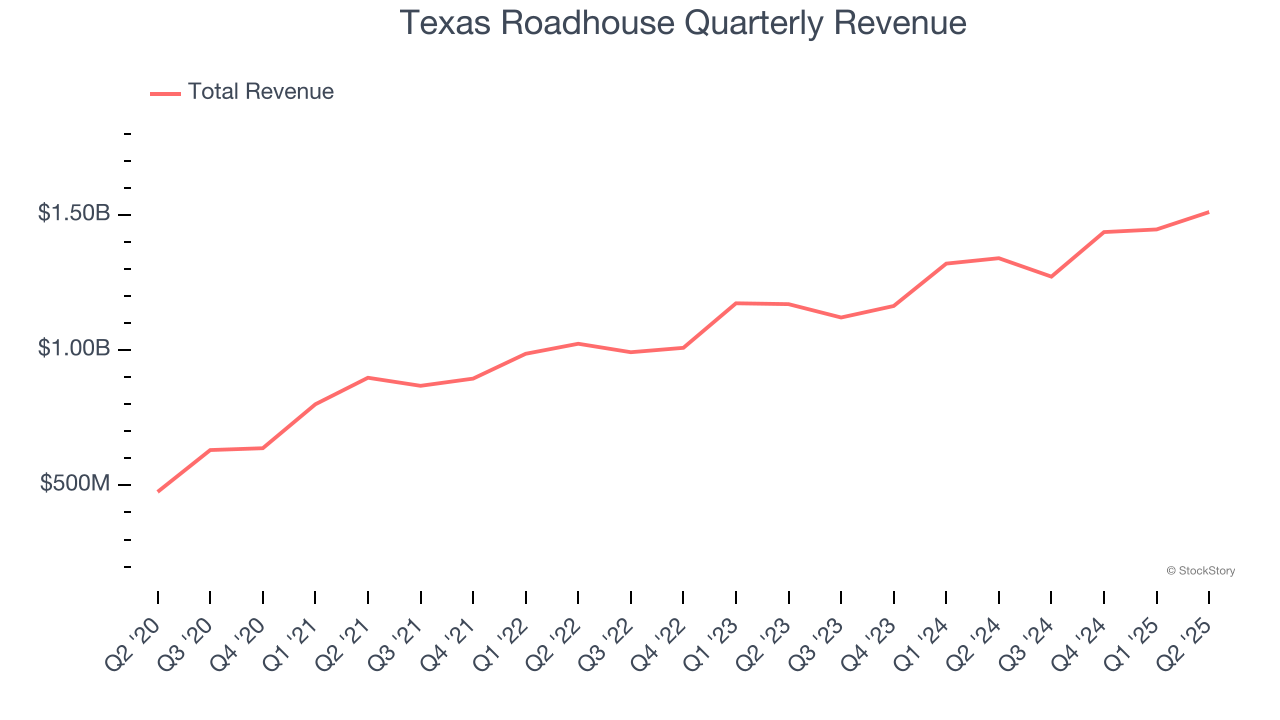
This quarter, Texas Roadhouse reported year-on-year revenue growth of 12.7%, and its $1.51 billion of revenue exceeded Wall Street’s estimates by 0.6%.
Looking ahead, sell-side analysts expect revenue to grow 8.3% over the next 12 months, a deceleration versus the last six years. Despite the slowdown, this projection is above the sector average and indicates the market is baking in some success for its newer menu offerings.
Here at StockStory, we certainly understand the potential of thematic investing. Diverse winners from Microsoft (MSFT) to Alphabet (GOOG), Coca-Cola (KO) to Monster Beverage (MNST) could all have been identified as promising growth stories with a megatrend driving the growth. So, in that spirit, we’ve identified a relatively under-the-radar profitable growth stock benefiting from the rise of AI, available to you FREE via this link.
Restaurant Performance
Number of Restaurants
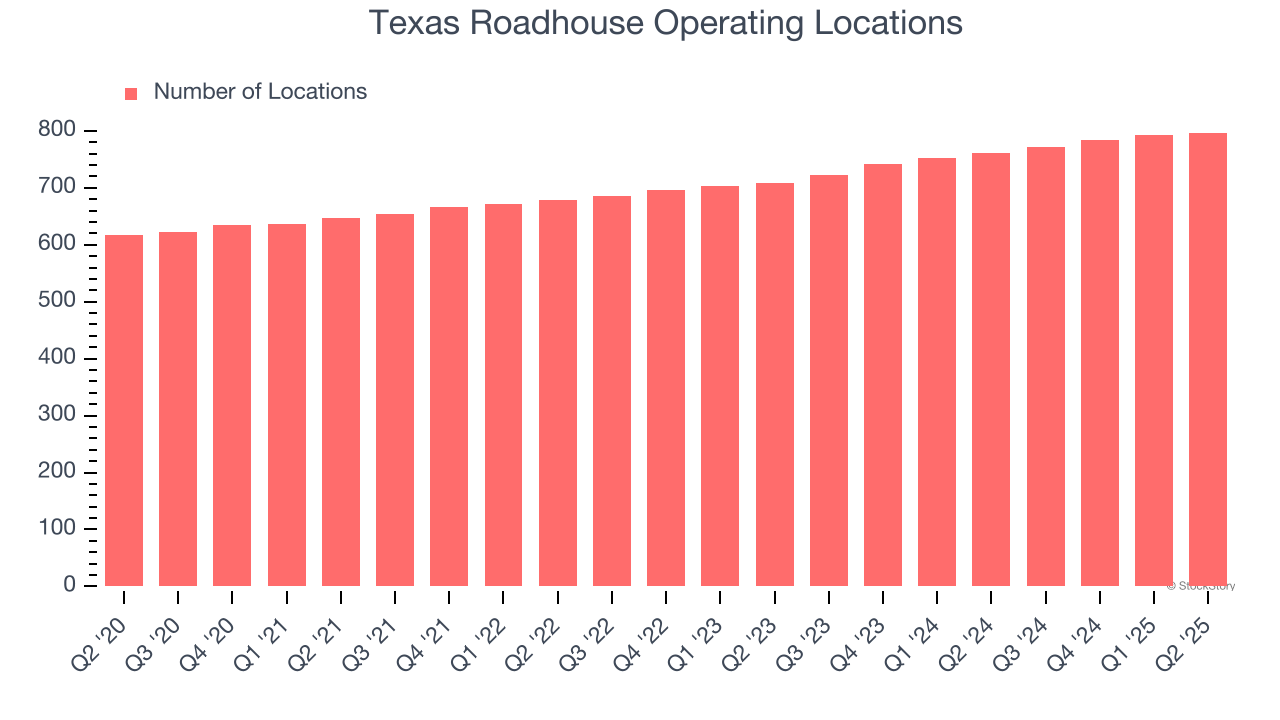
The number of dining locations a restaurant chain operates is a critical driver of how quickly company-level sales can grow.
Texas Roadhouse operated 797 locations in the latest quarter. It has opened new restaurants at a rapid clip over the last two years, averaging 6.1% annual growth, much faster than the broader restaurant sector.
When a chain opens new restaurants, it usually means it’s investing for growth because there’s healthy demand for its meals and there are markets where its concepts have few or no locations.
Same-Store Sales
A company's restaurant base only paints one part of the picture. When demand is high, it makes sense to open more. But when demand is low, it’s prudent to close some locations and use the money in other ways. Same-store sales is an industry measure of whether revenue is growing at those existing restaurants and is driven by customer visits (often called traffic) and the average spending per customer (ticket).
Texas Roadhouse has been one of the most successful restaurant chains over the last two years thanks to skyrocketing demand within its existing dining locations. On average, the company has posted exceptional year-on-year same-store sales growth of 7.5%. This performance suggests its rollout of new restaurants is beneficial for shareholders. We like this backdrop because it gives Texas Roadhouse multiple ways to win: revenue growth can come from new restaurants or increased foot traffic and higher sales per customer at existing locations.
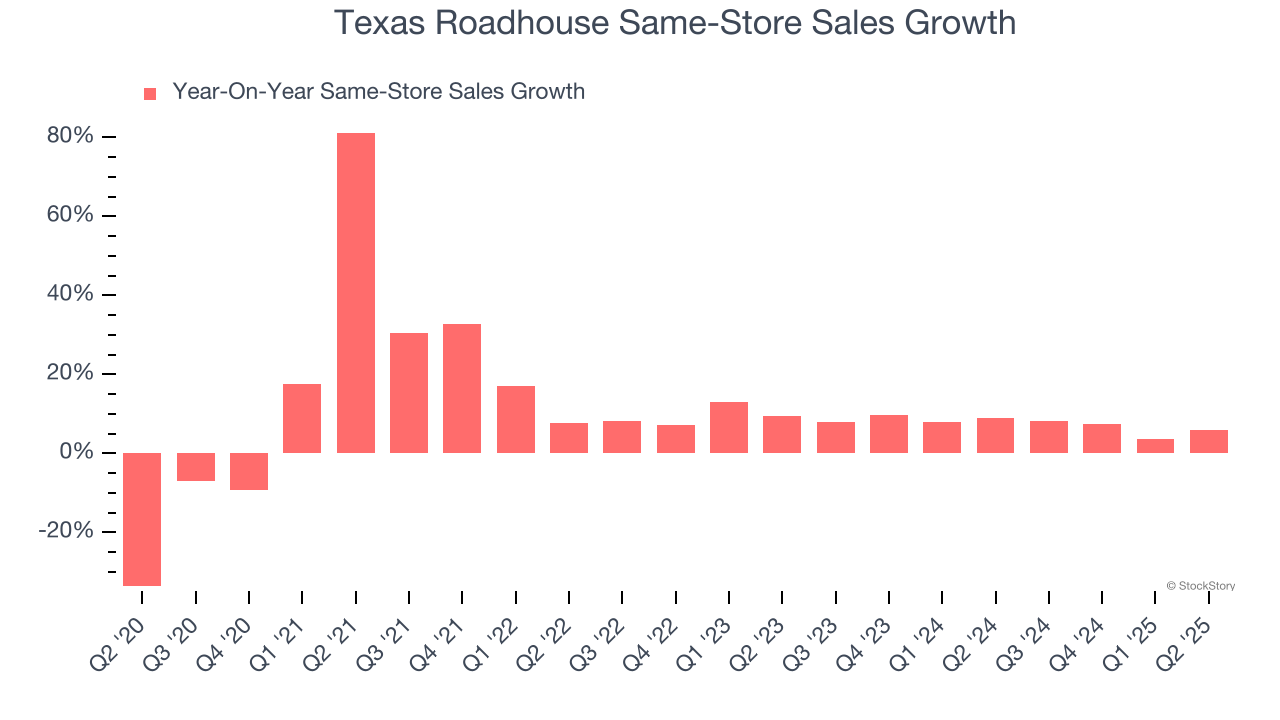
In the latest quarter, Texas Roadhouse’s same-store sales rose 5.9% year on year. This growth was a deceleration from its historical levels, showing the business is still performing well but losing a bit of steam.
Key Takeaways from Texas Roadhouse’s Q2 Results
It was good to see Texas Roadhouse narrowly top analysts’ same-store sales expectations this quarter. We were also happy its revenue narrowly outperformed Wall Street’s estimates. On the other hand, its EBITDA missed. Overall, this was a softer quarter. The stock traded down 2.5% to $180.47 immediately after reporting.
Is Texas Roadhouse an attractive investment opportunity right now? When making that decision, it’s important to consider its valuation, business qualities, as well as what has happened in the latest quarter. We cover that in our actionable full research report which you can read here, it’s free.