Theme park operator United Parks & Resorts (NYSE: PRKS) missed Wall Street’s revenue expectations in Q2 CY2025, with sales falling 1.5% year on year to $490.2 million. Its GAAP profit of $1.45 per share was 19.5% below analysts’ consensus estimates.
Is now the time to buy United Parks & Resorts? Find out by accessing our full research report, it’s free.
United Parks & Resorts (PRKS) Q2 CY2025 Highlights:
- Revenue: $490.2 million vs analyst estimates of $500.7 million (1.5% year-on-year decline, 2.1% miss)
- EPS (GAAP): $1.45 vs analyst expectations of $1.80 (19.5% miss)
- Adjusted EBITDA: $206.3 million vs analyst estimates of $217.2 million (42.1% margin, 5% miss)
- Operating Margin: 28.7%, down from 33% in the same quarter last year
- Free Cash Flow Margin: 26%, up from 18.8% in the same quarter last year
- Visitors: 6.23 million, in line with the same quarter last year
- Market Capitalization: $2.54 billion
Company Overview
Parent company of SeaWorld and home of the world-famous Shamu, United Parks & Resorts (NYSE: PRKS) is a theme park chain featuring marine life, live entertainment, roller coasters, and waterparks.
Revenue Growth
A company’s long-term performance is an indicator of its overall quality. Any business can experience short-term success, but top-performing ones enjoy sustained growth for years. Over the last five years, United Parks & Resorts grew its sales at a 12.6% annual rate. Although this growth is acceptable on an absolute basis, it fell short of our standards for the consumer discretionary sector, which enjoys a number of secular tailwinds.
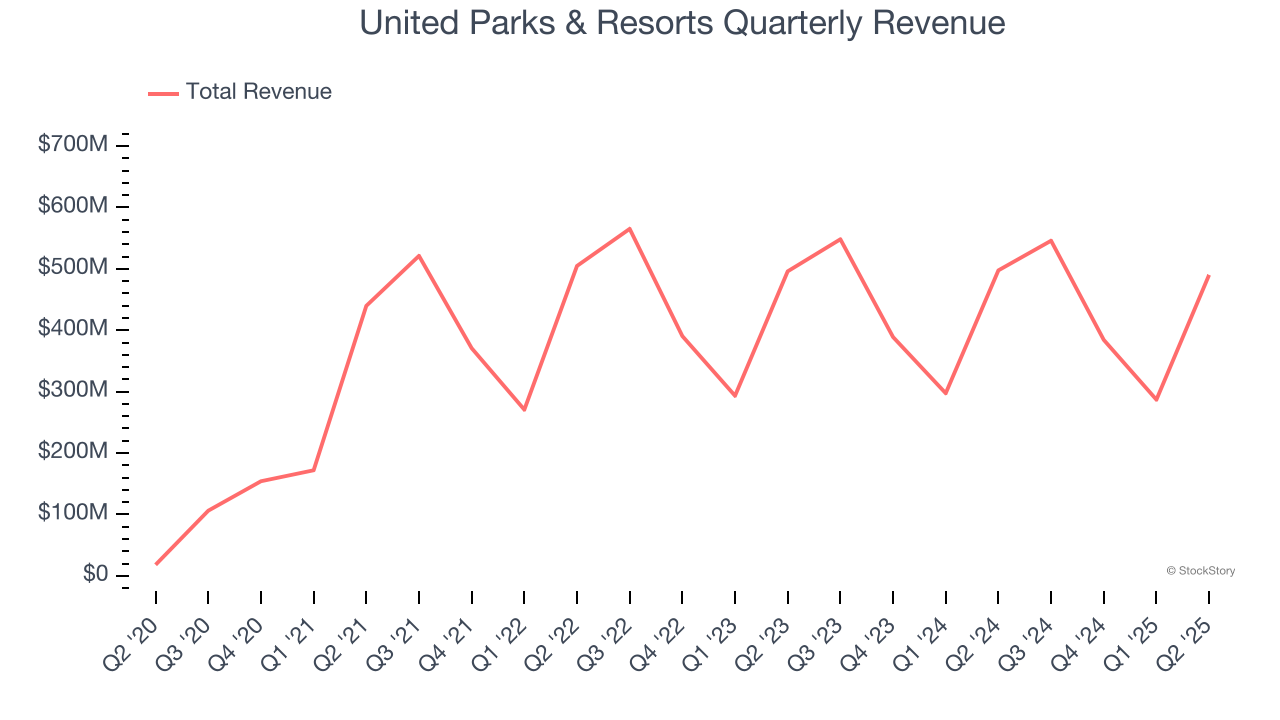
We at StockStory place the most emphasis on long-term growth, but within consumer discretionary, a stretched historical view may miss a company riding a successful new product or trend. United Parks & Resorts’s performance shows it grew in the past but relinquished its gains over the last two years, as its revenue fell by 1.1% annually. Note that COVID hurt United Parks & Resorts’s business in 2020 and part of 2021, and it bounced back in a big way thereafter. 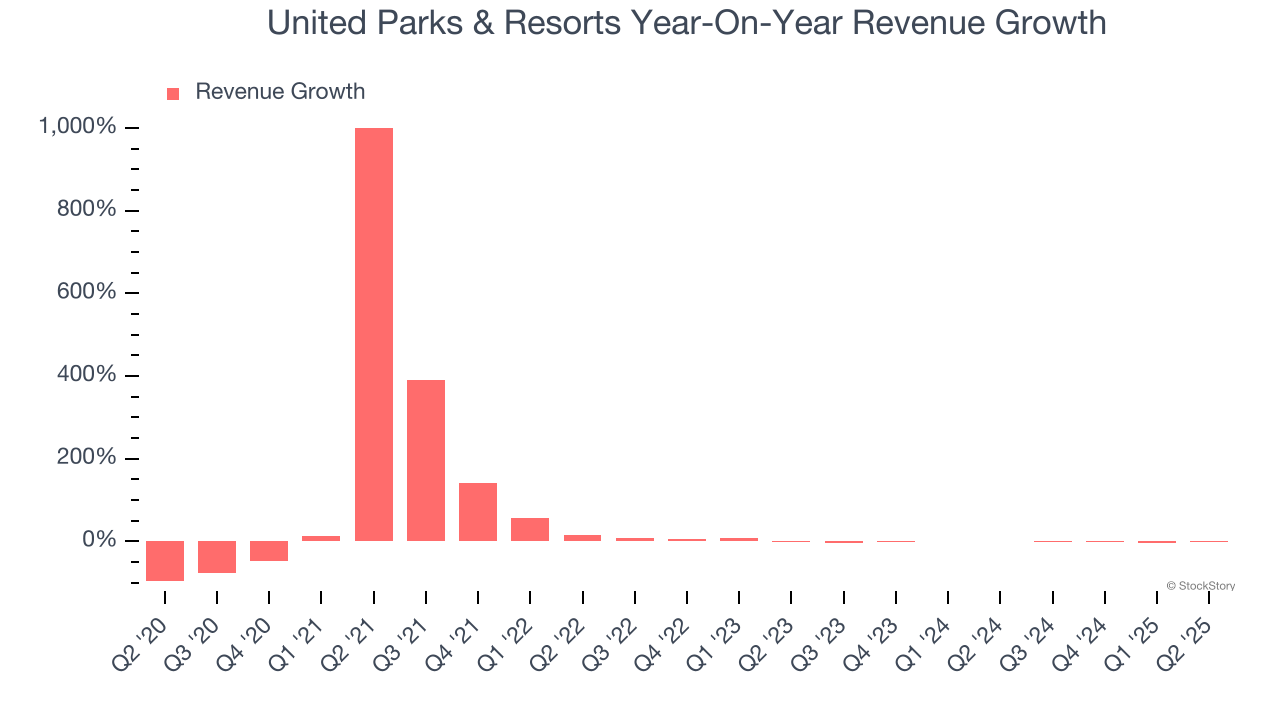
United Parks & Resorts also discloses its number of visitors, which reached 6.23 million in the latest quarter. Over the last two years, United Parks & Resorts’s visitors were flat. Because this number aligns with its revenue growth during the same period, we can see the company’s monetization was fairly consistent. 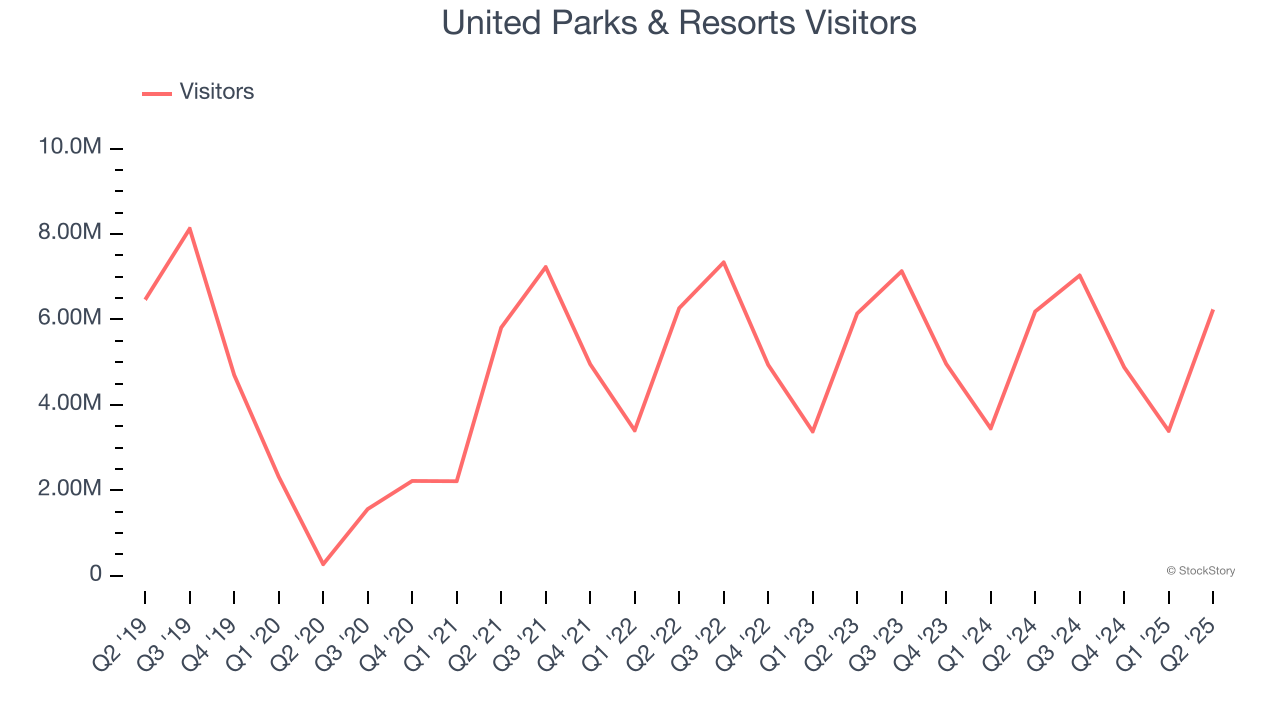
This quarter, United Parks & Resorts missed Wall Street’s estimates and reported a rather uninspiring 1.5% year-on-year revenue decline, generating $490.2 million of revenue.
Looking ahead, sell-side analysts expect revenue to remain flat over the next 12 months. Although this projection suggests its newer products and services will fuel better top-line performance, it is still below average for the sector.
Here at StockStory, we certainly understand the potential of thematic investing. Diverse winners from Microsoft (MSFT) to Alphabet (GOOG), Coca-Cola (KO) to Monster Beverage (MNST) could all have been identified as promising growth stories with a megatrend driving the growth. So, in that spirit, we’ve identified a relatively under-the-radar profitable growth stock benefiting from the rise of AI, available to you FREE via this link.
Operating Margin
Operating margin is a key measure of profitability. Think of it as net income - the bottom line - excluding the impact of taxes and interest on debt, which are less connected to business fundamentals.
United Parks & Resorts’s operating margin has been trending down over the last 12 months, but it still averaged 26.5% over the last two years, elite for a consumer discretionary business. This shows it’s an well-run company with an efficient cost structure, and we wouldn’t weigh the short-term trend too heavily.
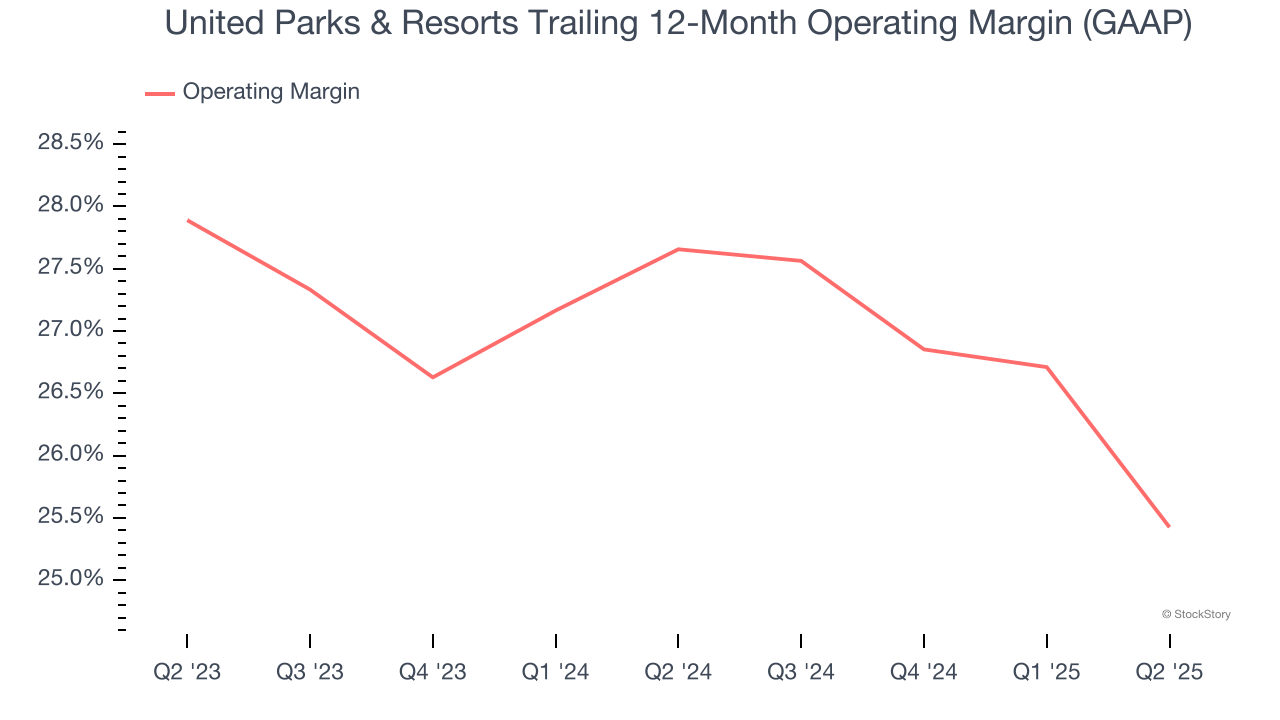
This quarter, United Parks & Resorts generated an operating margin profit margin of 28.7%, down 4.4 percentage points year on year. This contraction shows it was less efficient because its expenses increased relative to its revenue.
Earnings Per Share
We track the long-term change in earnings per share (EPS) for the same reason as long-term revenue growth. Compared to revenue, however, EPS highlights whether a company’s growth is profitable.
United Parks & Resorts’s full-year EPS flipped from negative to positive over the last five years. This is a good sign and shows it’s at an inflection point.
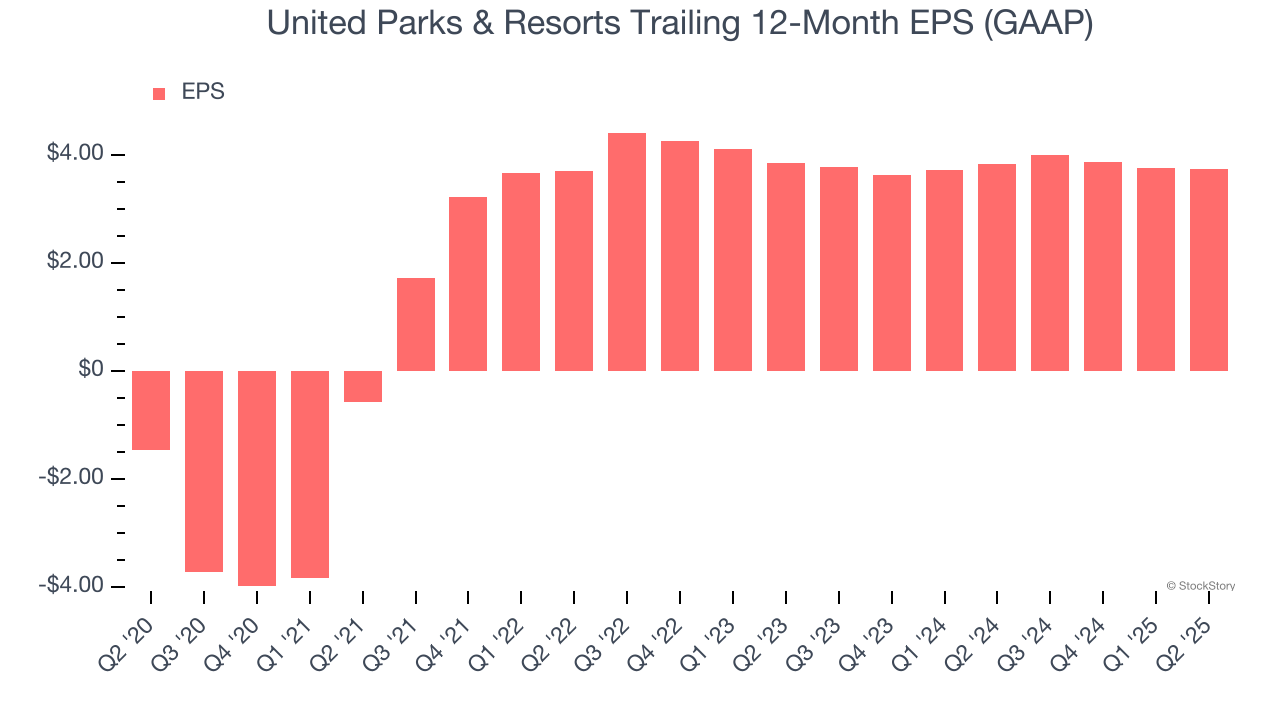
In Q2, United Parks & Resorts reported EPS at $1.45, down from $1.46 in the same quarter last year. This print missed analysts’ estimates, but we care more about long-term EPS growth than short-term movements. Over the next 12 months, Wall Street expects United Parks & Resorts’s full-year EPS of $3.74 to grow 25.2%.
Key Takeaways from United Parks & Resorts’s Q2 Results
We struggled to find many positives in these results. Its EPS missed and its adjusted operating income fell short of Wall Street’s estimates. Overall, this quarter could have been better. The stock traded up 6.5% to $49.17 immediately following the results.
Big picture, is United Parks & Resorts a buy here and now? The latest quarter does matter, but not nearly as much as longer-term fundamentals and valuation, when deciding if the stock is a buy. We cover that in our actionable full research report which you can read here, it’s free.