
Medication company Viatris (NASDAQ: VTRS) reported revenue ahead of Wall Street’s expectations in Q2 CY2025, but sales fell by 5.6% year on year to $3.58 billion. The company expects the full year’s revenue to be around $13.75 billion, close to analysts’ estimates. Its non-GAAP profit of $0.62 per share was 11.6% above analysts’ consensus estimates.
Is now the time to buy Viatris? Find out by accessing our full research report, it’s free.
Viatris (VTRS) Q2 CY2025 Highlights:
- Revenue: $3.58 billion vs analyst estimates of $3.44 billion (5.6% year-on-year decline, 4.2% beat)
- Adjusted EPS: $0.62 vs analyst estimates of $0.56 (11.6% beat)
- Adjusted EBITDA: $1.08 billion vs analyst estimates of $1.04 billion (30.1% margin, 3.7% beat)
- The company reconfirmed its revenue guidance for the full year of $13.75 billion at the midpoint
- Management reiterated its full-year Adjusted EPS guidance of $2.23 at the midpoint
- EBITDA guidance for the full year is $4.04 billion at the midpoint, in line with analyst expectations
- Operating Margin: 6.5%, up from -6.3% in the same quarter last year
- Free Cash Flow Margin: 4.7%, down from 8.4% in the same quarter last year
- Market Capitalization: $10.27 billion
Company Overview
Created through the 2020 merger of Mylan and Pfizer's Upjohn division, Viatris (NASDAQ: VTRS) is a healthcare company that develops, manufactures, and distributes branded and generic medicines across more than 165 countries worldwide.
Revenue Growth
A company’s long-term performance is an indicator of its overall quality. Any business can have short-term success, but a top-tier one grows for years. Unfortunately, Viatris’s 4.2% annualized revenue growth over the last five years was mediocre. This fell short of our benchmark for the healthcare sector and is a poor baseline for our analysis.
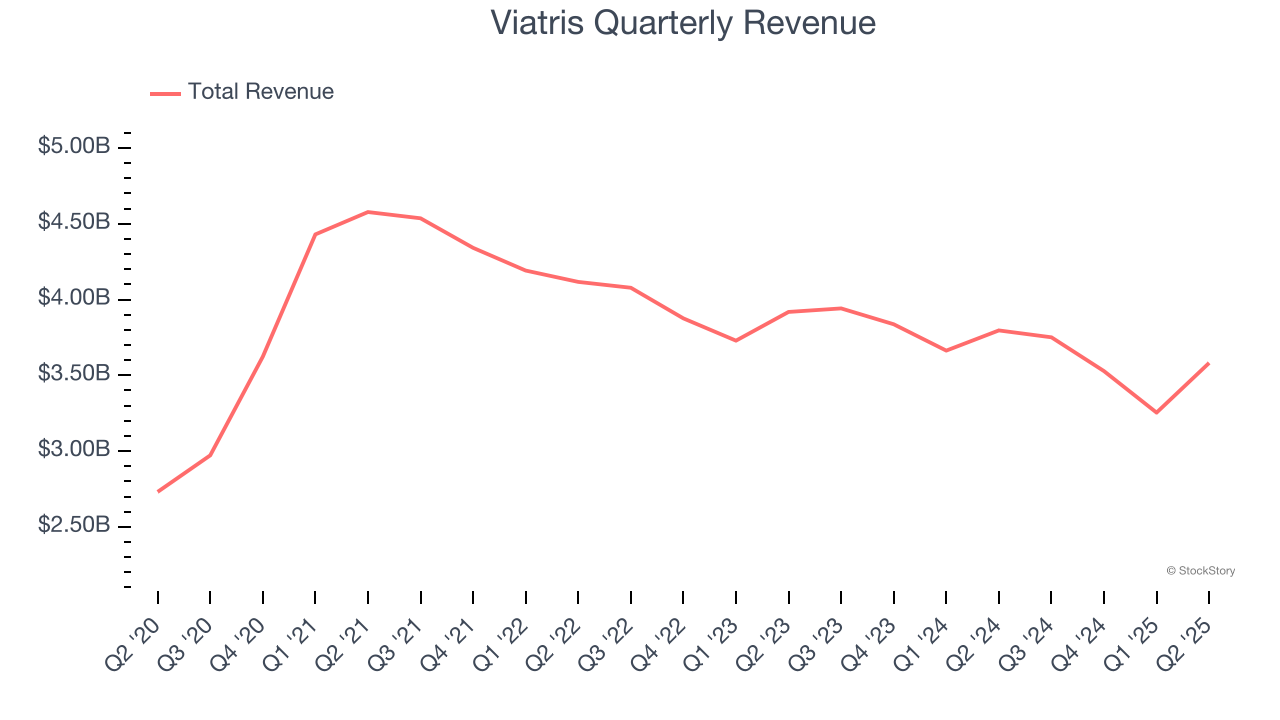
Long-term growth is the most important, but within healthcare, a half-decade historical view may miss new innovations or demand cycles. Viatris’s performance shows it grew in the past but relinquished its gains over the last two years, as its revenue fell by 4.9% annually. 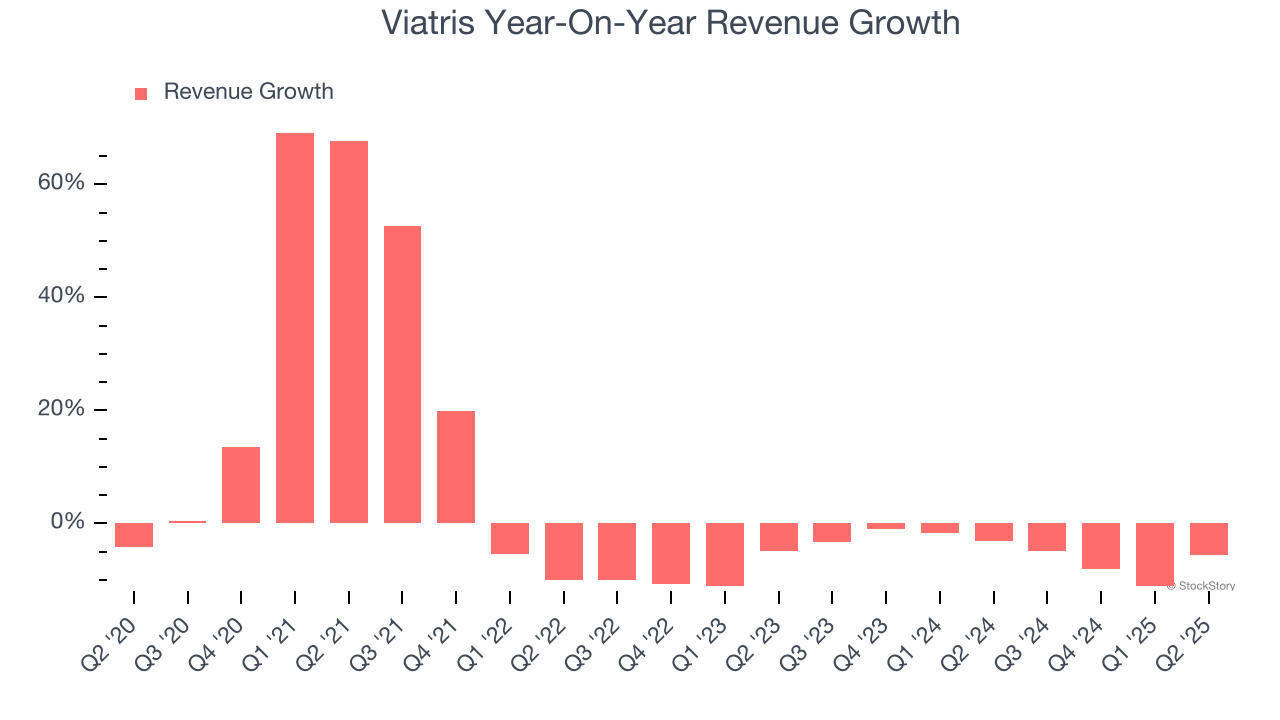
This quarter, Viatris’s revenue fell by 5.6% year on year to $3.58 billion but beat Wall Street’s estimates by 4.2%.
Looking ahead, sell-side analysts expect revenue to decline by 1.5% over the next 12 months. While this projection is better than its two-year trend, it’s hard to get excited about a company that is struggling with demand.
Here at StockStory, we certainly understand the potential of thematic investing. Diverse winners from Microsoft (MSFT) to Alphabet (GOOG), Coca-Cola (KO) to Monster Beverage (MNST) could all have been identified as promising growth stories with a megatrend driving the growth. So, in that spirit, we’ve identified a relatively under-the-radar profitable growth stock benefiting from the rise of AI, available to you FREE via this link.
Adjusted Operating Margin
Adjusted operating margin is an important measure of profitability as it shows the portion of revenue left after accounting for all core expenses – everything from the cost of goods sold to advertising and wages. It’s also useful for comparing profitability across companies because it excludes non-recurring expenses, interest on debt, and taxes.
Viatris has been a well-oiled machine over the last five years. It demonstrated elite profitability for a healthcare business, boasting an average adjusted operating margin of 31%.
Looking at the trend in its profitability, Viatris’s adjusted operating margin decreased by 4.9 percentage points over the last five years. The company’s two-year trajectory also shows it failed to get its profitability back to the peak as its margin fell by 4.9 percentage points. This performance was poor no matter how you look at it - it shows its expenses were rising and it couldn’t pass those costs onto its customers.
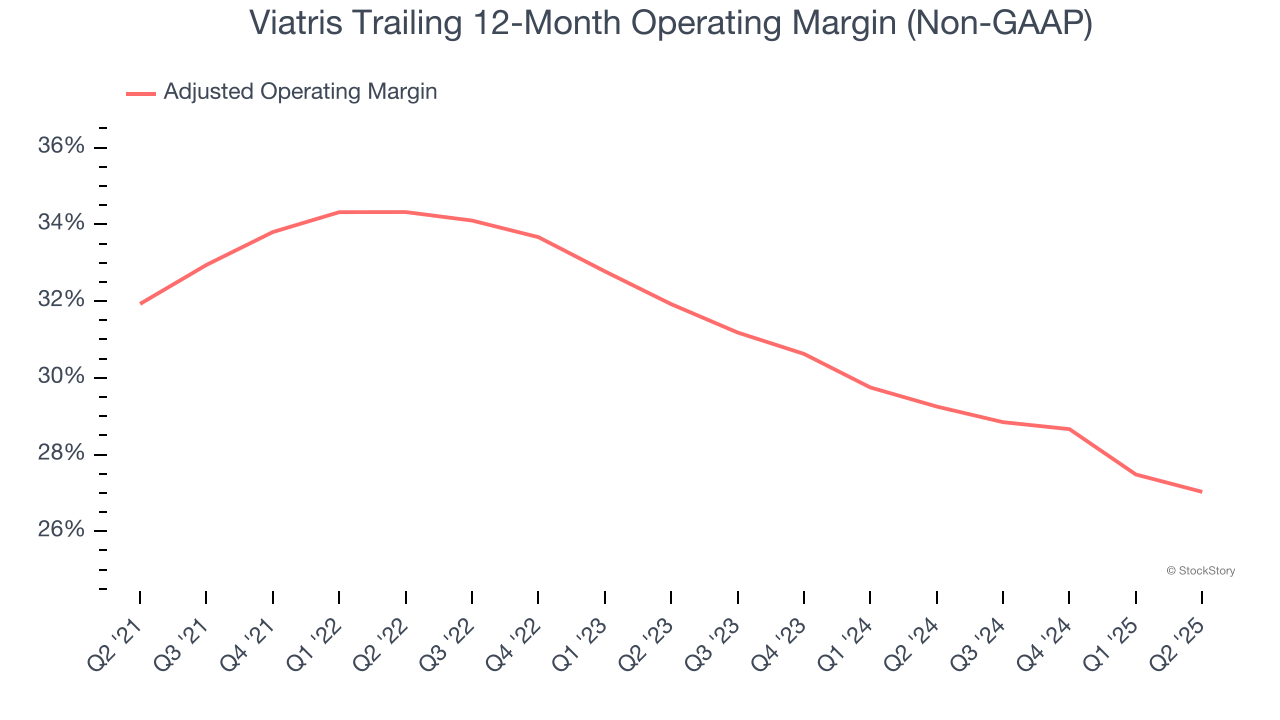
This quarter, Viatris generated an adjusted operating margin profit margin of 27.7%, down 1.7 percentage points year on year. This reduction is quite minuscule and indicates the company’s overall cost structure has been relatively stable.
Earnings Per Share
We track the long-term change in earnings per share (EPS) for the same reason as long-term revenue growth. Compared to revenue, however, EPS highlights whether a company’s growth is profitable.
Sadly for Viatris, its EPS declined by 12% annually over the last five years while its revenue grew by 4.2%. This tells us the company became less profitable on a per-share basis as it expanded.
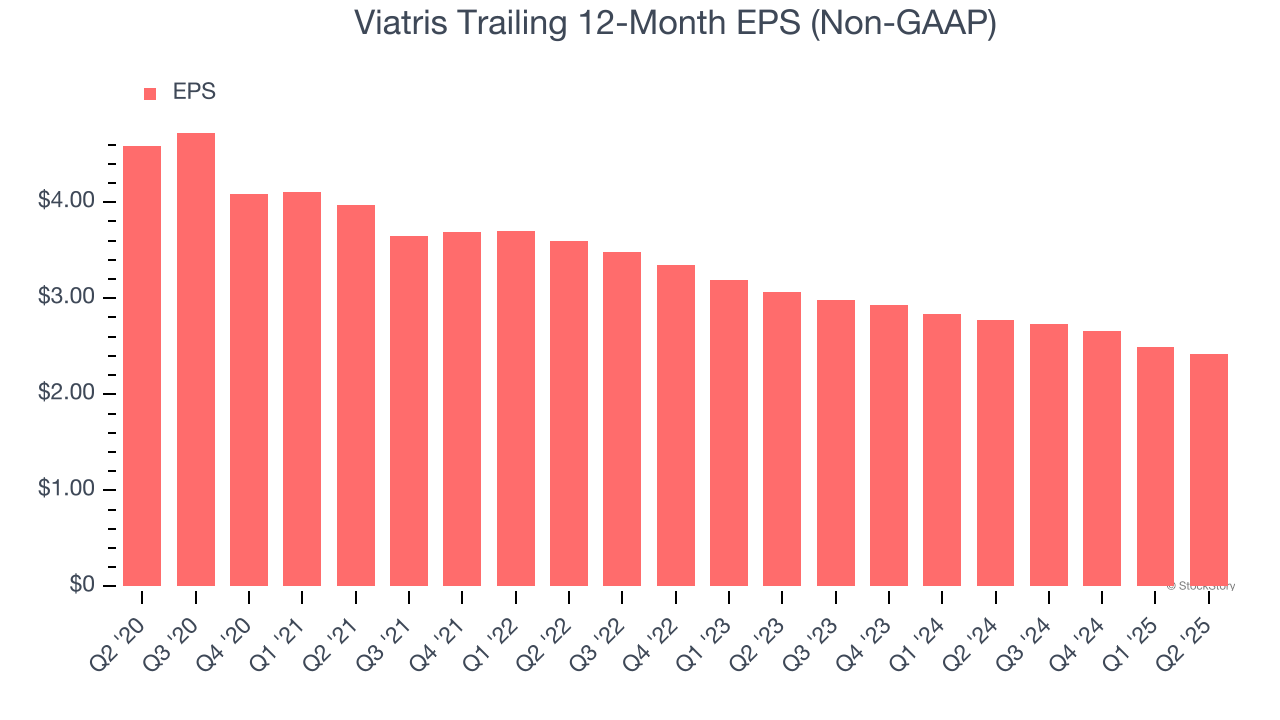
We can take a deeper look into Viatris’s earnings to better understand the drivers of its performance. As we mentioned earlier, Viatris’s adjusted operating margin declined by 4.9 percentage points over the last five years. Its share count also grew by 127%, meaning the company not only became less efficient with its operating expenses but also diluted its shareholders. 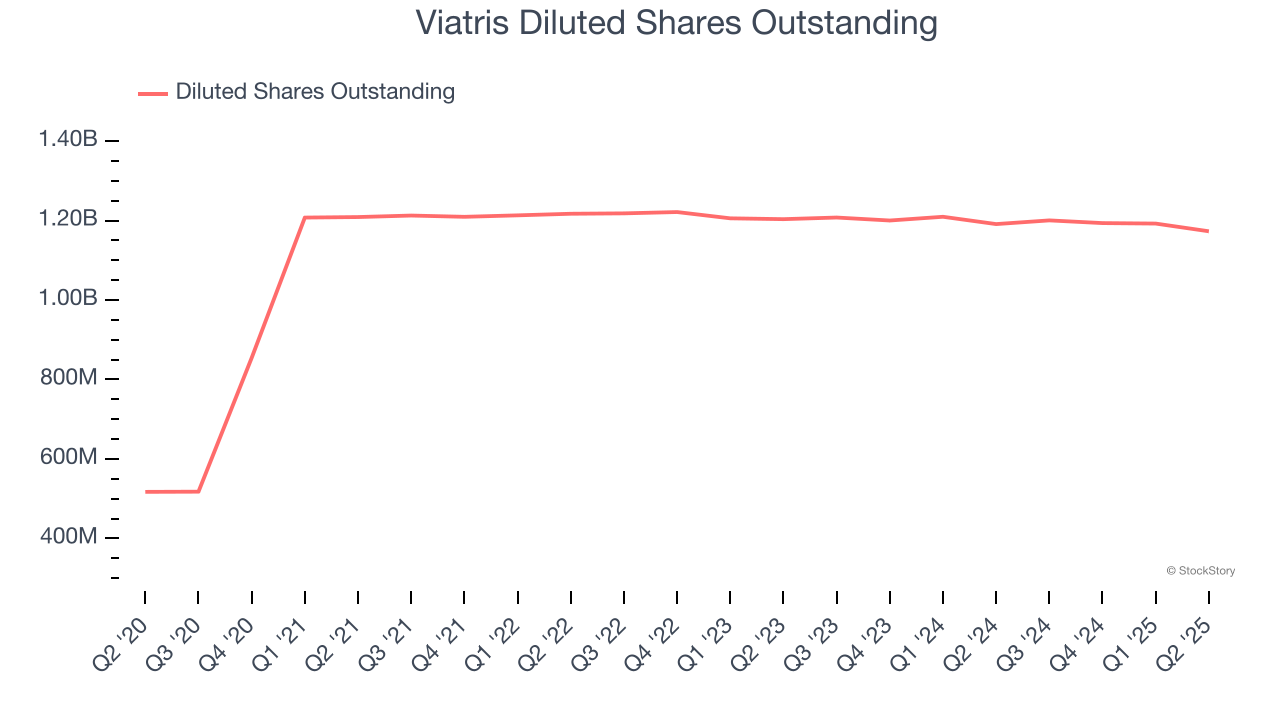
In Q2, Viatris reported adjusted EPS at $0.62, down from $0.69 in the same quarter last year. Despite falling year on year, this print easily cleared analysts’ estimates. Over the next 12 months, Wall Street expects Viatris’s full-year EPS of $2.42 to shrink by 4.5%.
Key Takeaways from Viatris’s Q2 Results
We enjoyed seeing Viatris beat analysts’ revenue expectations this quarter. We were also happy its EPS outperformed Wall Street’s estimates. On the other hand, its full-year revenue guidance was in line. Overall, this print had some key positives. The stock traded up 6.4% to $9.30 immediately following the results.
Sure, Viatris had a solid quarter, but if we look at the bigger picture, is this stock a buy? If you’re making that decision, you should consider the bigger picture of valuation, business qualities, as well as the latest earnings. We cover that in our actionable full research report which you can read here, it’s free.