
Eyewear retailer Warby Parker (NYSE: WRBY) reported Q2 CY2025 results topping the market’s revenue expectations, with sales up 13.9% year on year to $214.5 million. The company’s full-year revenue guidance of $884 million at the midpoint came in 0.7% above analysts’ estimates. Its GAAP loss of $0.01 per share was significantly below analysts’ consensus estimates.
Is now the time to buy Warby Parker? Find out by accessing our full research report, it’s free.
Warby Parker (WRBY) Q2 CY2025 Highlights:
- Revenue: $214.5 million vs analyst estimates of $213 million (13.9% year-on-year growth, 0.7% beat)
- EPS (GAAP): -$0.01 vs analyst estimates of $0.03 (significant miss)
- Adjusted EBITDA: $25.01 million vs analyst estimates of $21.75 million (11.7% margin, 15% beat)
- The company slightly lifted its revenue guidance for the full year to $884 million at the midpoint from $877.5 million
- EBITDA guidance for the full year is $101 million at the midpoint, above analyst estimates of $95.39 million
- Operating Margin: -2.1%, up from -4.8% in the same quarter last year
- Free Cash Flow Margin: 11.1%, up from 7.4% in the same quarter last year
- Active Customers: 2.6 million
- Market Capitalization: $2.95 billion
“When Steve joined Warby Parker fourteen years ago as our first CFO, he brought financial rigor, strategic vision, and an unwavering commitment to creating impact both inside and outside of the organization,” says Gilboa.
Company Overview
Founded in 2010, Warby Parker (NYSE: WRBY) designs, manufactures, and sells eyewear, including prescription glasses, sunglasses, and contact lenses, through its e-commerce platform and physical retail locations.
Revenue Growth
A company’s long-term sales performance is one signal of its overall quality. Even a bad business can shine for one or two quarters, but a top-tier one grows for years.
With $821.3 million in revenue over the past 12 months, Warby Parker is a small retailer, which sometimes brings disadvantages compared to larger competitors benefiting from economies of scale and negotiating leverage with suppliers. On the bright side, it can grow faster because it has more white space to build new stores.
As you can see below, Warby Parker grew its sales at an impressive 16.9% compounded annual growth rate over the last six years (we compare to 2019 to normalize for COVID-19 impacts) as it opened new stores and expanded its reach.
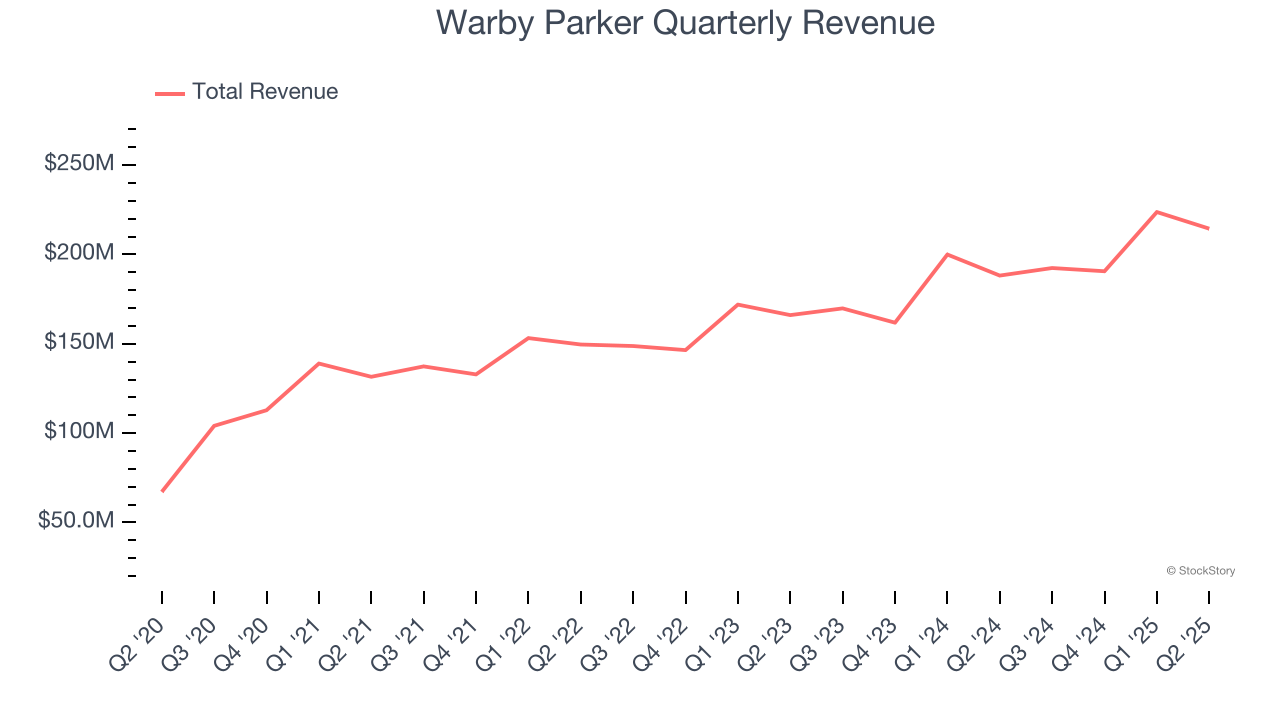
This quarter, Warby Parker reported year-on-year revenue growth of 13.9%, and its $214.5 million of revenue exceeded Wall Street’s estimates by 0.7%.
Looking ahead, sell-side analysts expect revenue to grow 14.3% over the next 12 months, a slight deceleration versus the last six years. Despite the slowdown, this projection is commendable and indicates the market is forecasting success for its products.
Today’s young investors won’t have read the timeless lessons in Gorilla Game: Picking Winners In High Technology because it was written more than 20 years ago when Microsoft and Apple were first establishing their supremacy. But if we apply the same principles, then enterprise software stocks leveraging their own generative AI capabilities may well be the Gorillas of the future. So, in that spirit, we are excited to present our Special Free Report on a profitable, fast-growing enterprise software stock that is already riding the automation wave and looking to catch the generative AI next.
Number of Stores
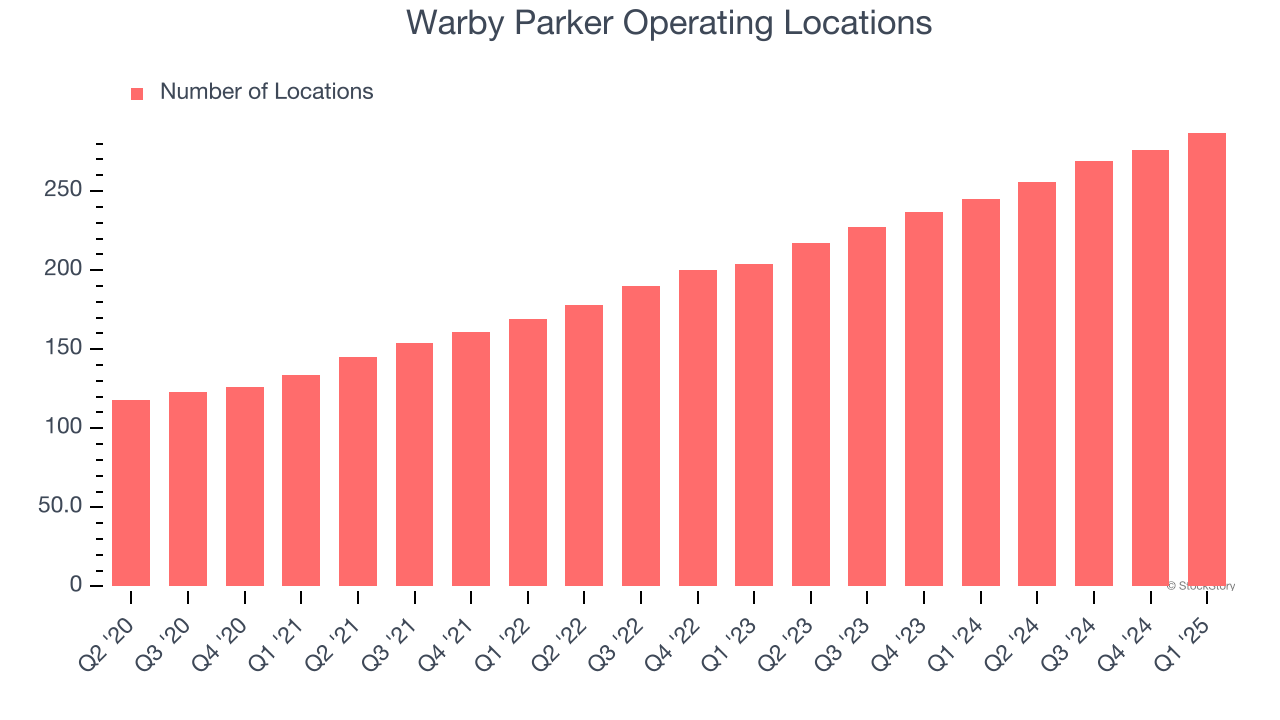
A retailer’s store count influences how much it can sell and how quickly revenue can grow.
Over the last two years, Warby Parker opened new stores at a rapid clip by averaging 18.3% annual growth, among the fastest in the consumer retail sector. This gives it a chance to scale into a mid-sized business over time.
When a retailer opens new stores, it usually means it’s investing for growth because demand is greater than supply, especially in areas where consumers may not have a store within reasonable driving distance.
Note that Warby Parker reports its store count intermittently, so some data points are missing in the chart below.
Key Takeaways from Warby Parker’s Q2 Results
We were impressed by how significantly Warby Parker blew past analysts’ EBITDA expectations this quarter. We were also glad its full-year EBITDA guidance trumped Wall Street’s estimates. On the other hand, its EPS missed and its gross margin fell short of Wall Street’s estimates. Overall, this print was mixed but still had some key positives. Investors were likely hoping for more, and shares traded down 4.3% to $23.26 immediately after reporting.
Should you buy the stock or not? What happened in the latest quarter matters, but not as much as longer-term business quality and valuation, when deciding whether to invest in this stock. We cover that in our actionable full research report which you can read here, it’s free.