
Luxury hotels and casino operator Wynn Resorts (NASDAQ: WYNN) fell short of the market’s revenue expectations in Q2 CY2025, with sales flat year on year at $1.74 billion. Its non-GAAP profit of $1.09 per share was 9% below analysts’ consensus estimates.
Is now the time to buy Wynn Resorts? Find out by accessing our full research report, it’s free.
Wynn Resorts (WYNN) Q2 CY2025 Highlights:
- Revenue: $1.74 billion vs analyst estimates of $1.75 billion (flat year on year, 0.6% miss)
- Adjusted EPS: $1.09 vs analyst expectations of $1.20 (9% miss)
- Adjusted EBITDA: $446.3 million vs analyst estimates of $551.7 million (25.7% margin, 19.1% miss)
- Operating Margin: 15.2%, in line with the same quarter last year
- Market Capitalization: $11.1 billion
Company Overview
Founded by the former Mirage Resorts CEO, Wynn Resorts (NASDAQ: WYNN) is a global developer and operator of high-end hotels and casinos, known for its luxurious properties and premium guest services.
Revenue Growth
A company’s long-term sales performance can indicate its overall quality. Any business can put up a good quarter or two, but many enduring ones grow for years. Regrettably, Wynn Resorts’s sales grew at a tepid 9.9% compounded annual growth rate over the last five years. This was below our standard for the consumer discretionary sector and is a tough starting point for our analysis.
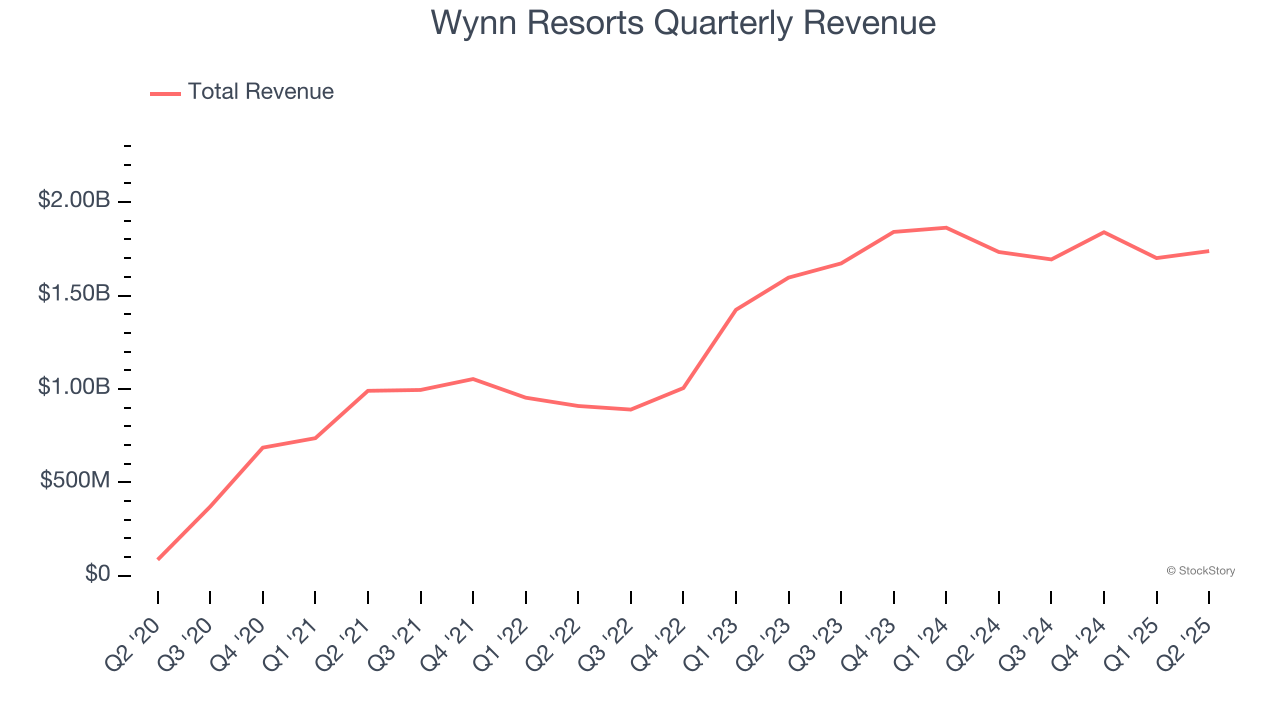
We at StockStory place the most emphasis on long-term growth, but within consumer discretionary, a stretched historical view may miss a company riding a successful new product or trend. Wynn Resorts’s annualized revenue growth of 19.1% over the last two years is above its five-year trend, suggesting its demand recently accelerated. Note that COVID hurt Wynn Resorts’s business in 2020 and part of 2021, and it bounced back in a big way thereafter. 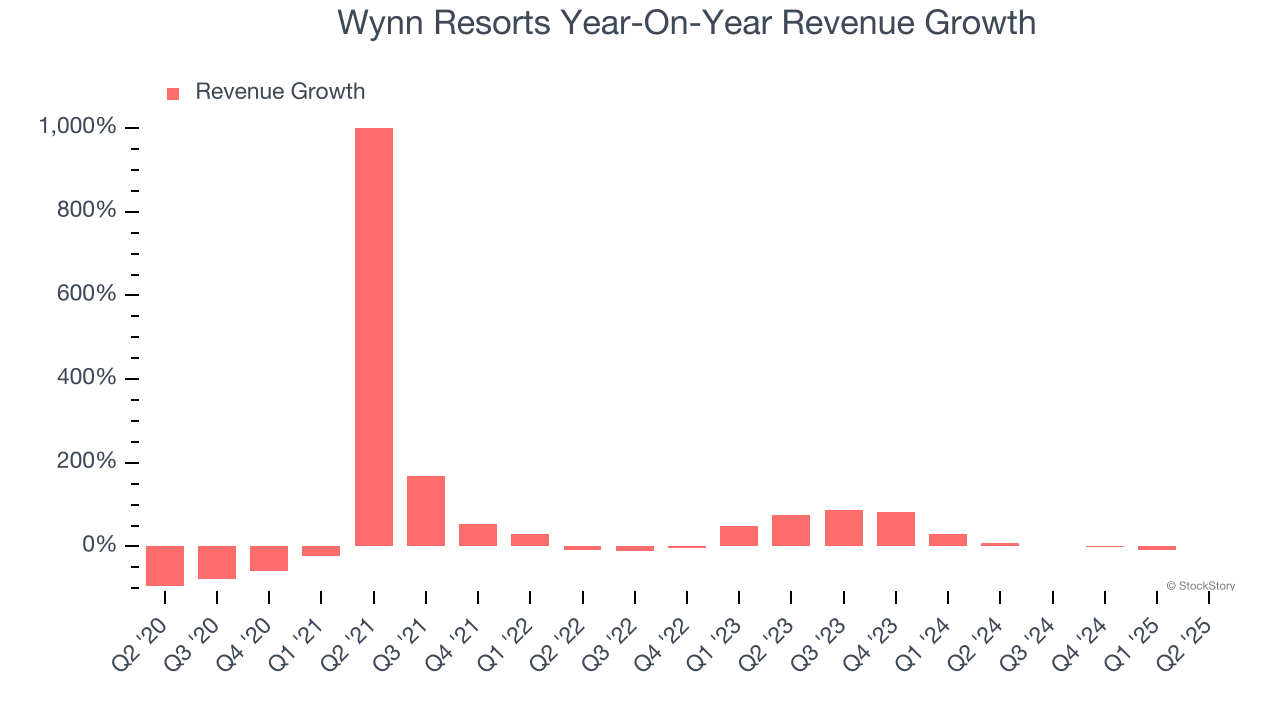
We can dig further into the company’s revenue dynamics by analyzing its three most important segments: Casino, Hotel, and Dining and Entertainment, which are 60.5%, 16.7%, and 15% of revenue. Over the last two years, Wynn Resorts’s revenues in all three segments increased. Its Casino revenue (Poker, slots) averaged year-on-year growth of 48.1% while its Hotel (overnight bookings) and Dining and Entertainment (food, beverage, Wynn Interactive) revenues averaged 12.2% and 3%. 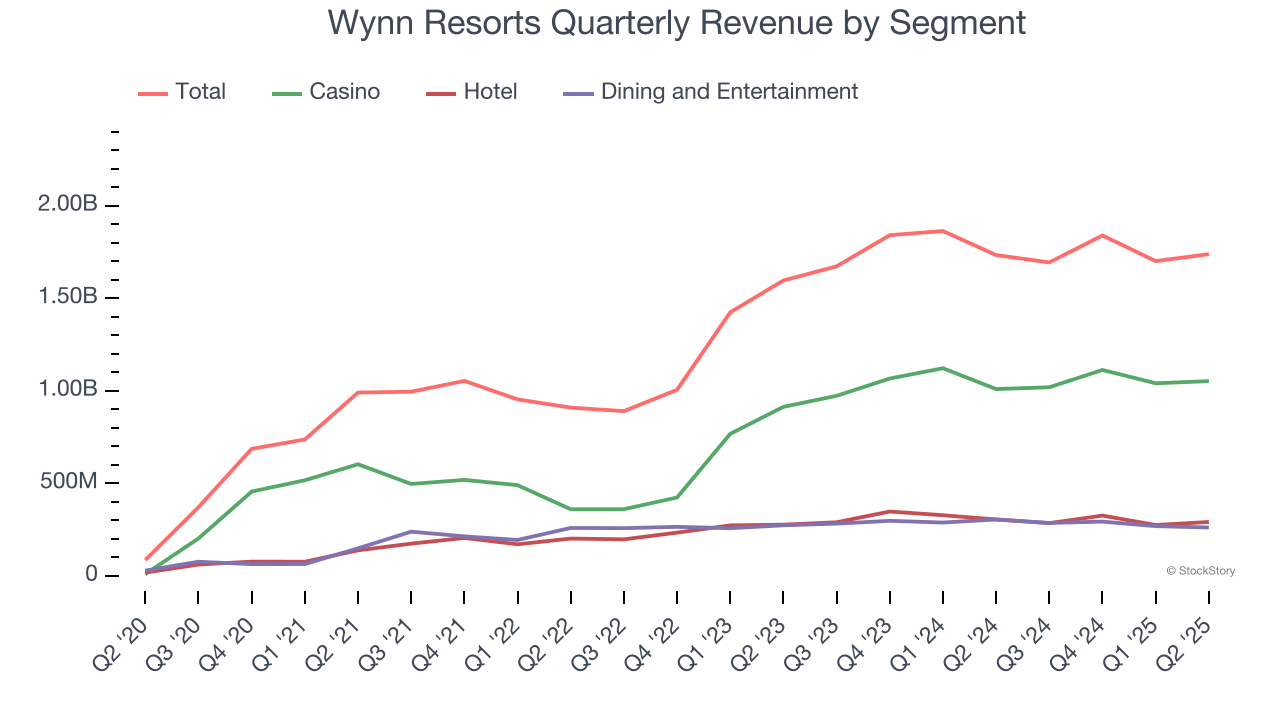
This quarter, Wynn Resorts’s $1.74 billion of revenue was flat year on year, falling short of Wall Street’s estimates.
Looking ahead, sell-side analysts expect revenue to grow 1.6% over the next 12 months, a deceleration versus the last two years. This projection is underwhelming and indicates its products and services will face some demand challenges.
Software is eating the world and there is virtually no industry left that has been untouched by it. That drives increasing demand for tools helping software developers do their jobs, whether it be monitoring critical cloud infrastructure, integrating audio and video functionality, or ensuring smooth content streaming. Click here to access a free report on our 3 favorite stocks to play this generational megatrend.
Operating Margin
Operating margin is an important measure of profitability as it shows the portion of revenue left after accounting for all core expenses – everything from the cost of goods sold to advertising and wages. It’s also useful for comparing profitability across companies with different levels of debt and tax rates because it excludes interest and taxes.
Wynn Resorts’s operating margin might fluctuated slightly over the last 12 months but has generally stayed the same, averaging 14.8% over the last two years. This profitability was solid for a consumer discretionary business and shows it’s an efficient company that manages its expenses well.
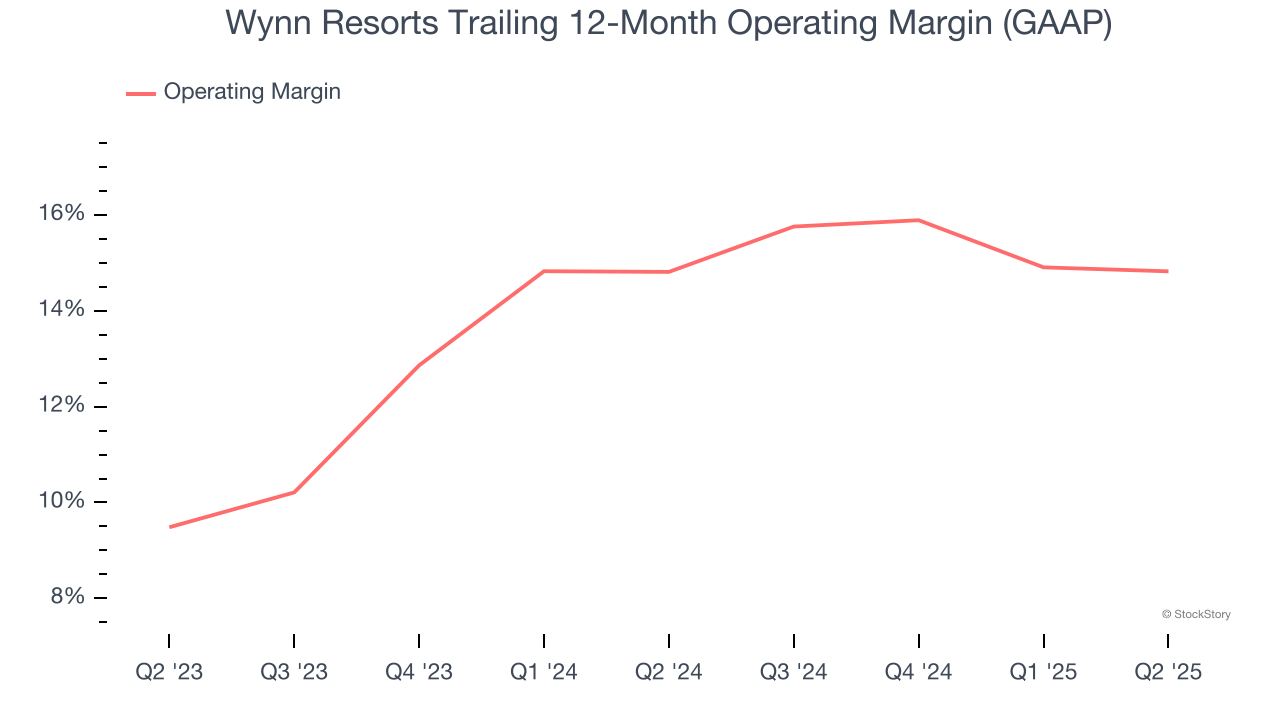
In Q2, Wynn Resorts generated an operating margin profit margin of 15.2%, in line with the same quarter last year. This indicates the company’s overall cost structure has been relatively stable.
Earnings Per Share
Revenue trends explain a company’s historical growth, but the long-term change in earnings per share (EPS) points to the profitability of that growth – for example, a company could inflate its sales through excessive spending on advertising and promotions.
Wynn Resorts’s full-year EPS flipped from negative to positive over the last five years. This is encouraging and shows it’s at a critical moment in its life.
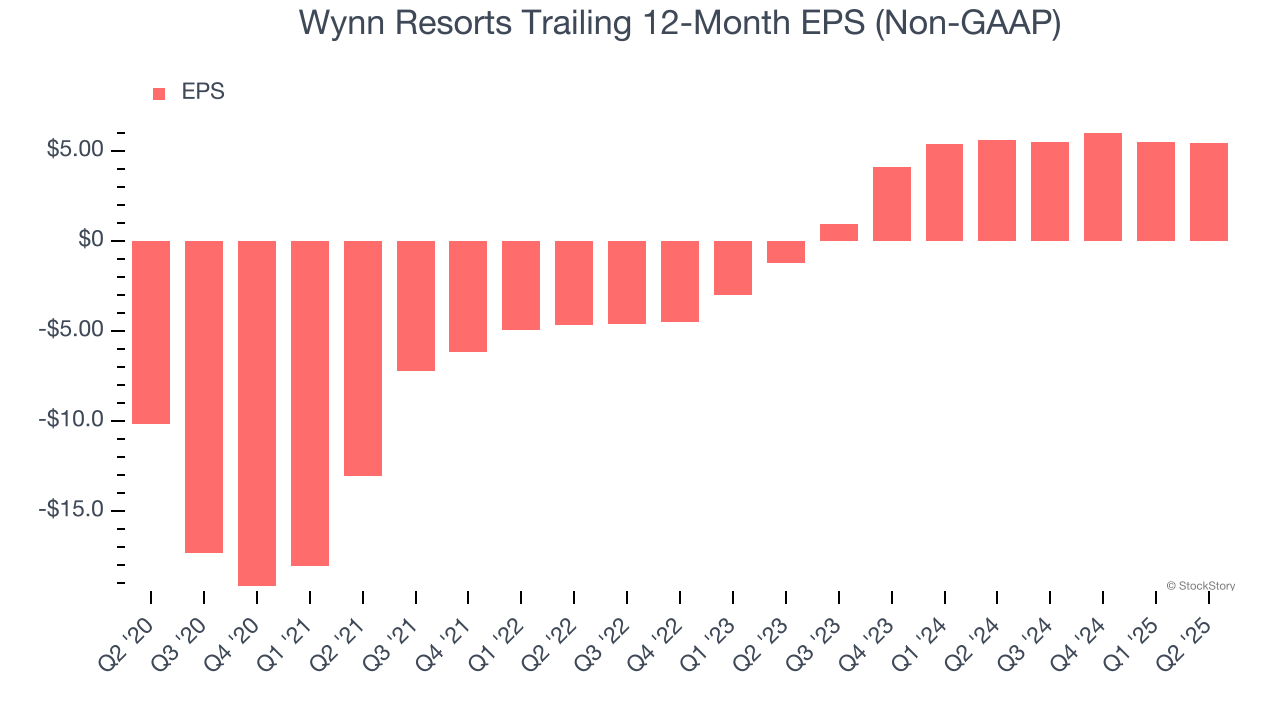
In Q2, Wynn Resorts reported adjusted EPS at $1.09, down from $1.12 in the same quarter last year. This print missed analysts’ estimates, but we care more about long-term adjusted EPS growth than short-term movements. Over the next 12 months, Wall Street expects Wynn Resorts’s full-year EPS of $5.48 to shrink by 14.9%.
Key Takeaways from Wynn Resorts’s Q2 Results
We struggled to find many positives in these results. Its EPS missed and its EBITDA fell short of Wall Street’s estimates. Overall, this was a softer quarter. The stock traded down 2% to $105 immediately following the results.
The latest quarter from Wynn Resorts’s wasn’t that good. One earnings report doesn’t define a company’s quality, though, so let’s explore whether the stock is a buy at the current price. The latest quarter does matter, but not nearly as much as longer-term fundamentals and valuation, when deciding if the stock is a buy. We cover that in our actionable full research report which you can read here, it’s free.


