
Stock Yards Bank has been treading water for the past six months, recording a small loss of 2.7% while holding steady at $73.23. The stock also fell short of the S&P 500’s 5.3% gain during that period.
Is now the time to buy SYBT? Or does the price properly account for its business quality and fundamentals? Find out in our full research report, it’s free.
Why Does SYBT Stock Spark Debate?
Founded in 1904 in Louisville and named after the city's historic livestock market district, Stock Yards Bancorp (NASDAQ: SYBT) operates a regional bank providing commercial banking, wealth management, and trust services across Kentucky, Indiana, and Ohio.
Two Positive Attributes:
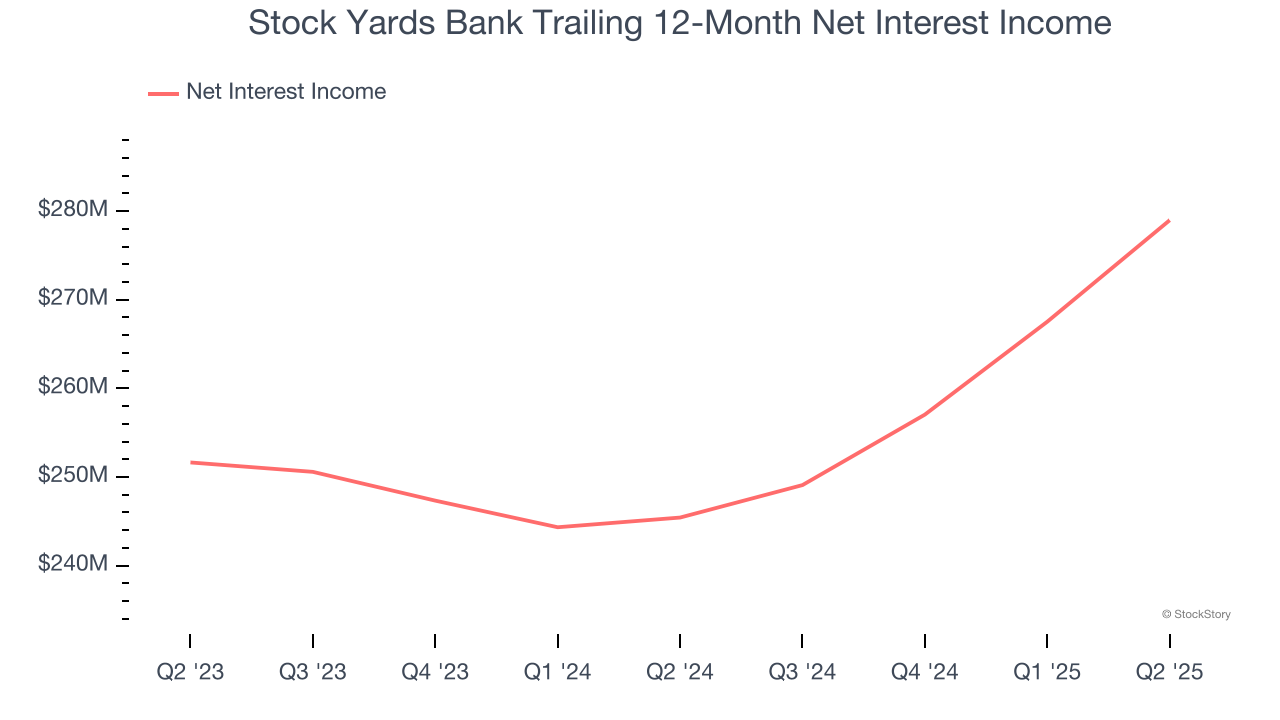
1. Net Interest Income Skyrockets, Fueling Growth Opportunities
While bank generate revenue from multiple sources, investors view net interest income as a cornerstone - its predictable, recurring characteristics stand in sharp contrast to the volatility of one-time fees.
Stock Yards Bank’s net interest income has grown at a 16.9% annualized rate over the last five years, much better than the broader bank industry and faster than its total revenue. Its growth was driven by both an increase in its outstanding loans and net interest margin, which represents how much a bank earns in relation to its outstanding loan book.
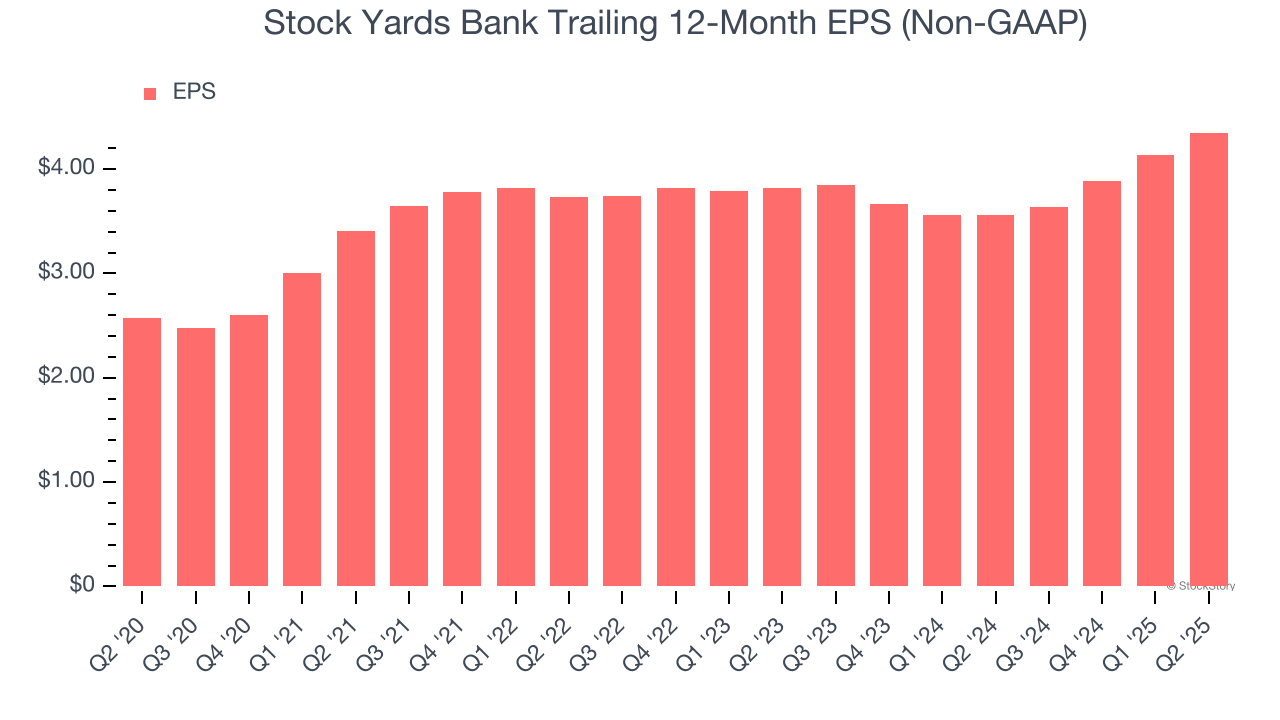
2. Outstanding Long-Term EPS Growth
Analyzing the long-term change in earnings per share (EPS) shows whether a company's incremental sales were profitable – for example, revenue could be inflated through excessive spending on advertising and promotions.
Stock Yards Bank’s EPS grew at an astounding 11.1% compounded annual growth rate over the last five years. This performance was better than most bank businesses.
One Reason to be Careful:
Projected Net Interest Income Growth Is Slim
Forecasted net interest income by Wall Street analysts signals a company’s potential. Predictions may not always be accurate, but accelerating growth typically boosts valuation multiples and stock prices while slowing growth does the opposite.
Over the next 12 months, sell-side analysts expect Stock Yards Bank’s net interest income to rise by 4.8%, close to its 5.3% annualized growth for the past two years.
Final Judgment
Stock Yards Bank’s positive characteristics outweigh the negatives. With its shares lagging the market recently, the stock trades at 2× forward P/B (or $73.23 per share). Is now a good time to initiate a position? See for yourself in our in-depth research report, it’s free.
High-Quality Stocks for All Market Conditions
Trump’s April 2025 tariff bombshell triggered a massive market selloff, but stocks have since staged an impressive recovery, leaving those who panic sold on the sidelines.
Take advantage of the rebound by checking out our Top 9 Market-Beating Stocks. This is a curated list of our High Quality stocks that have generated a market-beating return of 183% over the last five years (as of March 31st 2025).
Stocks that made our list in 2020 include now familiar names such as Nvidia (+1,545% between March 2020 and March 2025) as well as under-the-radar businesses like the once-small-cap company Exlservice (+354% five-year return). Find your next big winner with StockStory today.
StockStory is growing and hiring equity analyst and marketing roles. Are you a 0 to 1 builder passionate about the markets and AI? See the open roles here.