
Insurance and technology company HCI Group (NYSE: HCI) announced better-than-expected revenue in Q2 CY2025, with sales up 7.6% year on year to $221.9 million. Its GAAP profit of $5.06 per share was 15.4% above analysts’ consensus estimates.
Is now the time to buy HCI Group? Find out by accessing our full research report, it’s free.
HCI Group (HCI) Q2 CY2025 Highlights:
- Net Premiums Earned: $200.1 million vs analyst estimates of $201.9 million (7.1% year-on-year growth, 0.9% miss)
- Revenue: $221.9 million vs analyst estimates of $219.4 million (7.6% year-on-year growth, 1.1% beat)
- Pre-Tax Profit Margin: 42.5% (5.7 percentage point year-on-year increase)
- EPS (GAAP): $5.06 vs analyst estimates of $4.38 (15.4% beat)
- Market Capitalization: $1.59 billion
Management Commentary“HCI Group delivered another strong quarter, marked by solid profitability, industry-leading net combined ratios, and meaningful growth in book value per share,” said HCI Group Chairman and Chief Executive Officer Paresh Patel.
Company Overview
Starting as a Florida "take-out" insurer that assumed policies from the state-backed Citizens Property Insurance Corporation, HCI Group (NYSE: HCI) provides property and casualty insurance, primarily homeowners coverage, while leveraging proprietary technology to improve underwriting and claims processing.
Revenue Growth
In general, insurance companies earn revenue from three primary sources. The first is the core insurance business itself, often called underwriting and represented in the income statement as premiums earned. The second source is investment income from investing the “float” (premiums collected upfront not yet paid out as claims) in assets such as fixed-income assets and equities. The third is fees from various sources such as policy administration, annuities, or other value-added services.
Thankfully, HCI Group’s 24.5% annualized revenue growth over the last five years was incredible. Its growth surpassed the average insurance company and shows its offerings resonate with customers, a great starting point for our analysis.
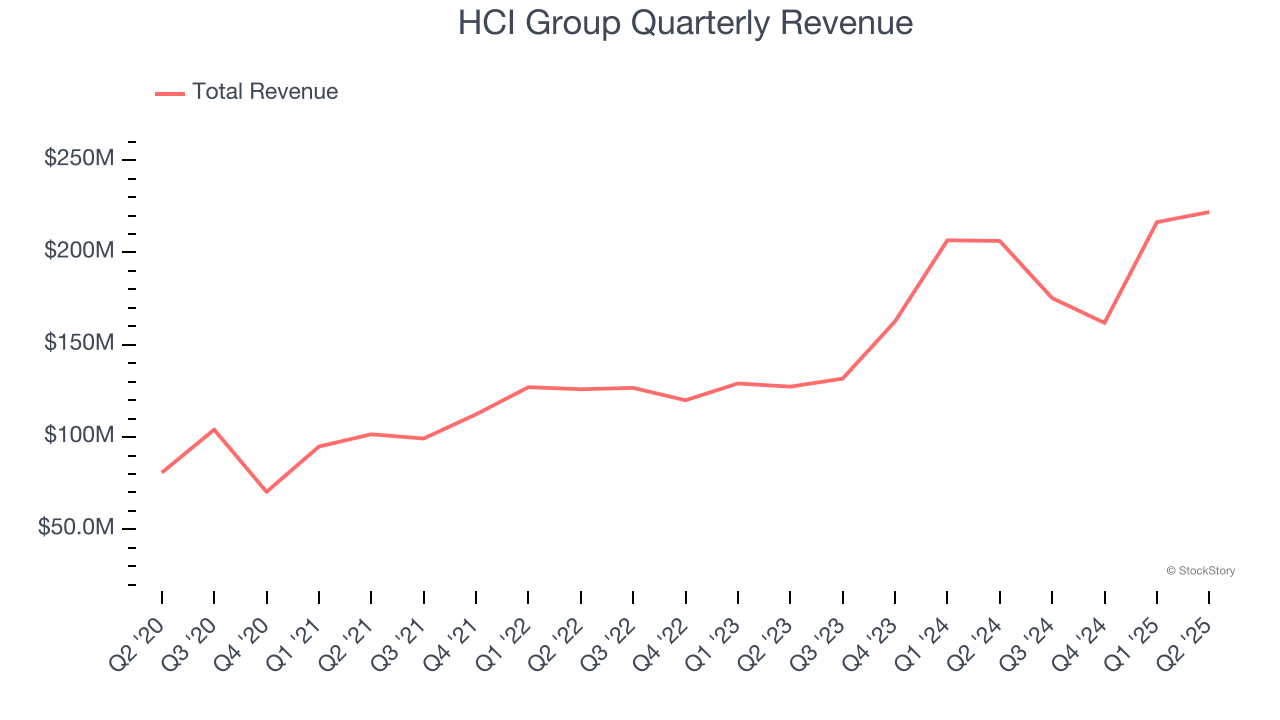
Long-term growth is the most important, but within financials, a half-decade historical view may miss recent interest rate changes and market returns. HCI Group’s annualized revenue growth of 24.2% over the last two years aligns with its five-year trend, suggesting its demand was predictably strong. 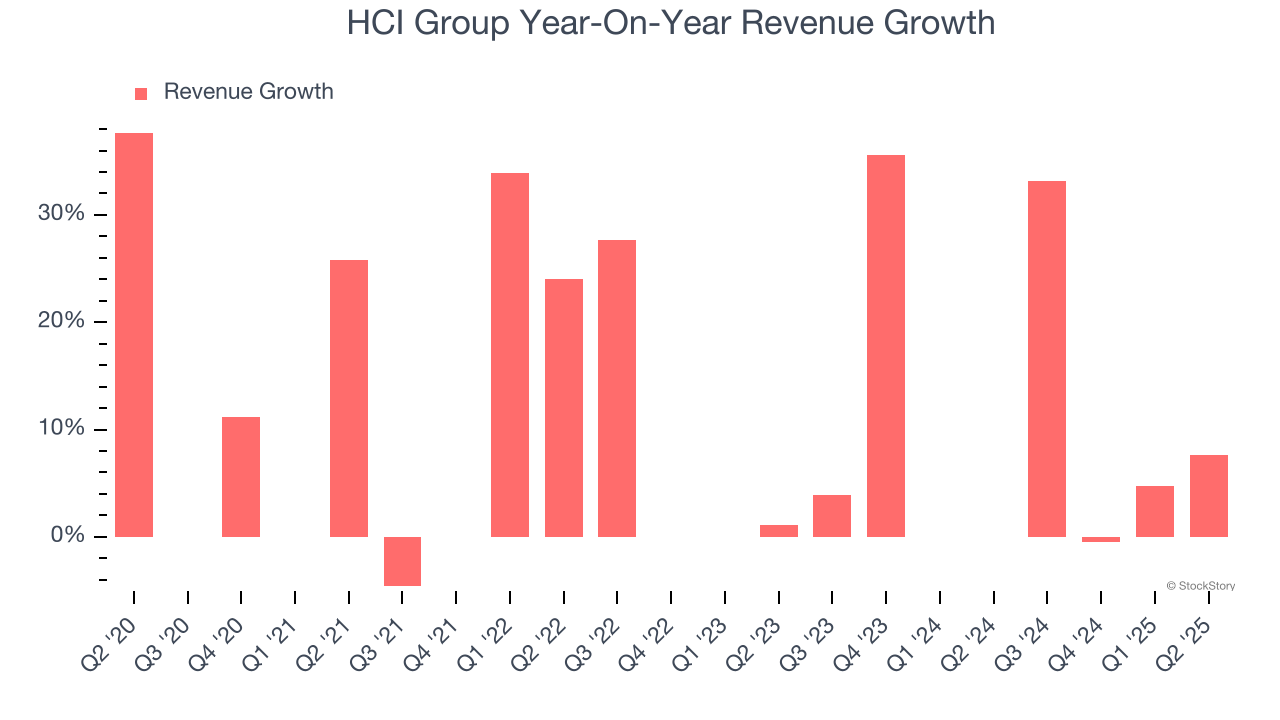 Note: Quarters not shown were determined to be outliers, impacted by outsized investment gains/losses that are not indicative of the recurring fundamentals of the business.
This quarter, HCI Group reported year-on-year revenue growth of 7.6%, and its $221.9 million of revenue exceeded Wall Street’s estimates by 1.1%.
Net premiums earned made up 90.1% of the company’s total revenue during the last five years, meaning HCI Group lives and dies by its underwriting activities because non-insurance operations barely move the needle.
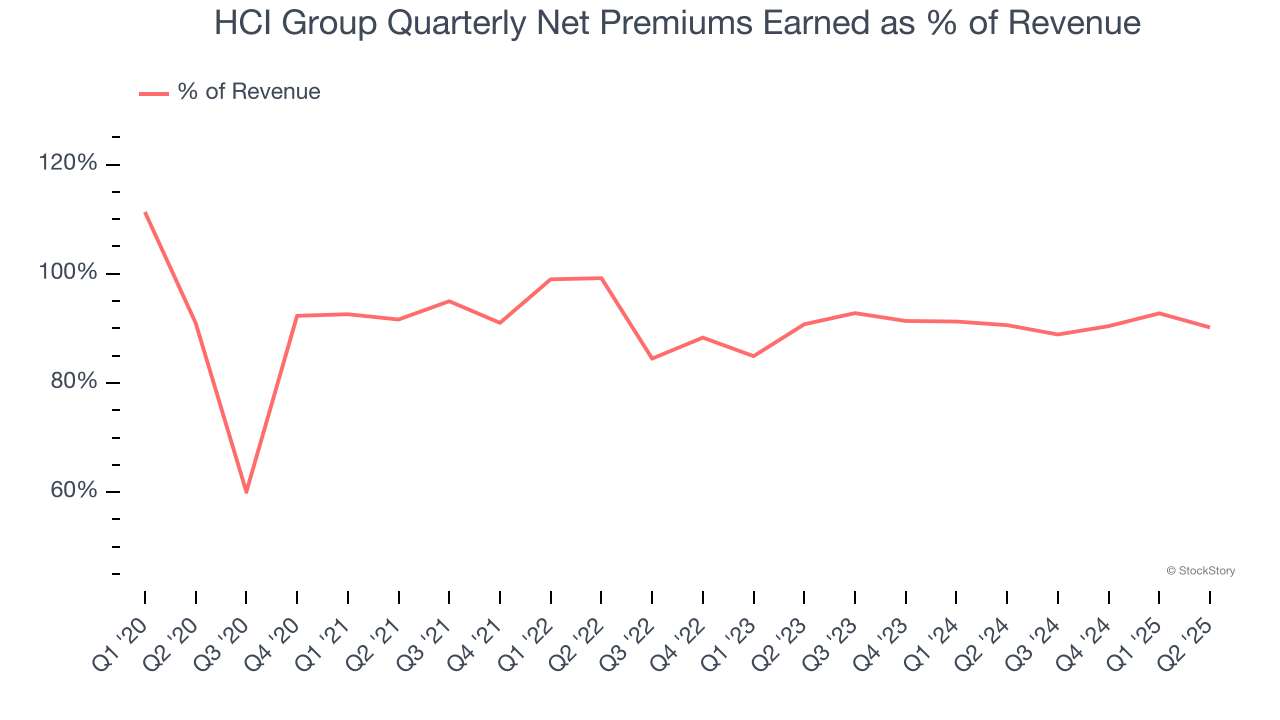
Net premiums earned commands greater market attention due to its reliability and consistency, whereas investment and fee income are often seen as more volatile revenue streams that fluctuate with market conditions.
Today’s young investors won’t have read the timeless lessons in Gorilla Game: Picking Winners In High Technology because it was written more than 20 years ago when Microsoft and Apple were first establishing their supremacy. But if we apply the same principles, then enterprise software stocks leveraging their own generative AI capabilities may well be the Gorillas of the future. So, in that spirit, we are excited to present our Special Free Report on a profitable, fast-growing enterprise software stock that is already riding the automation wave and looking to catch the generative AI next.
Book Value Per Share (BVPS)
Insurance companies are balance sheet businesses, collecting premiums upfront and paying out claims over time. The float–premiums collected but not yet paid out–are invested, creating an asset base supported by a liability structure. Book value per share (BVPS) captures this dynamic by measuring these assets (investment portfolio, cash, reinsurance recoverables) less liabilities (claim reserves, debt, future policy benefits). BVPS is essentially the residual value for shareholders.
We therefore consider BVPS very important to track for insurers and a metric that sheds light on business quality because it reflects long-term capital growth and is harder to manipulate than more commonly-used metrics like EPS.
HCI Group’s BVPS grew at an incredible 19.8% annual clip over the last five years. BVPS growth has also accelerated recently, growing by 63.4% annually over the last two years from $21.92 to $58.55 per share.
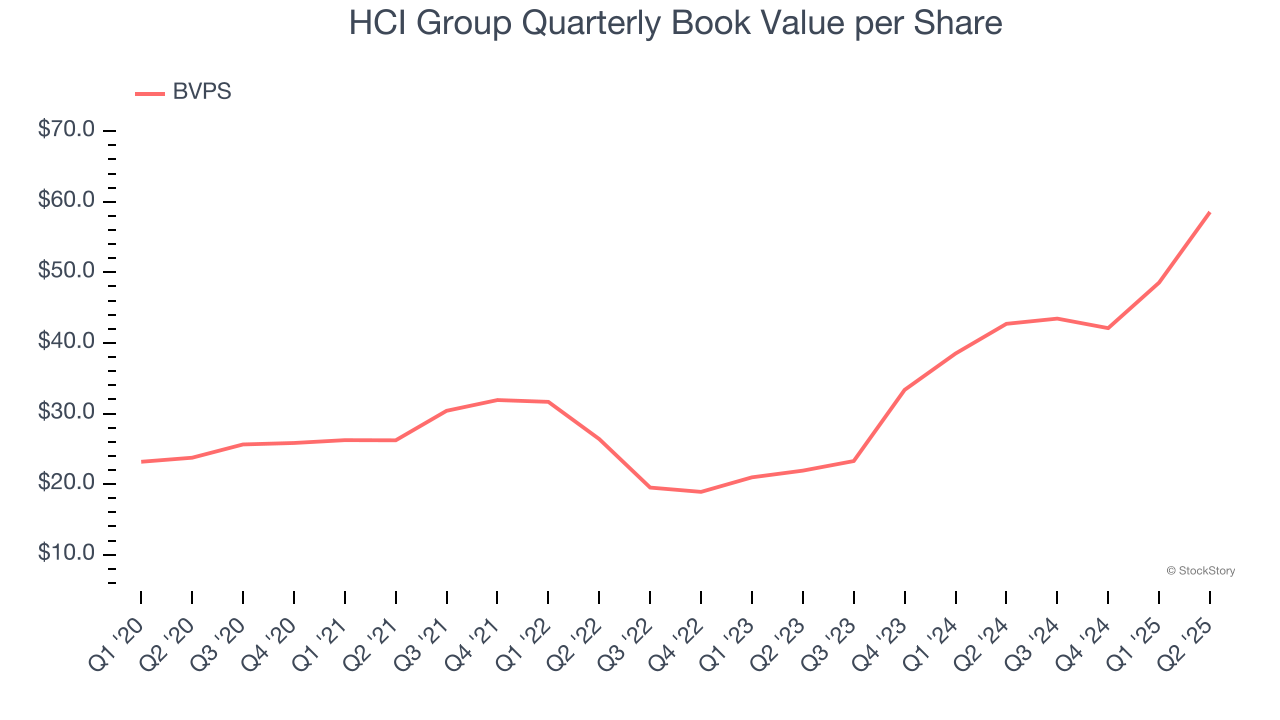
Over the next 12 months, Consensus estimates call for HCI Group’s BVPS to grow by 21% to $54.98, elite growth rate.
Key Takeaways from HCI Group’s Q2 Results
We were impressed by how significantly HCI Group blew past analysts’ book value per share expectations this quarter. We were also glad its EPS outperformed Wall Street’s estimates. On the other hand, its net premiums earned slightly missed. Zooming out, we think this was a good print with some key areas of upside. The stock remained flat at $137.88 immediately after reporting.
HCI Group may have had a good quarter, but does that mean you should invest right now? When making that decision, it’s important to consider its valuation, business qualities, as well as what has happened in the latest quarter. We cover that in our actionable full research report which you can read here, it’s free.