
Energy drink company Monster Beverage (NASDAQ: MNST) reported Q2 CY2025 results exceeding the market’s revenue expectations, with sales up 11.1% year on year to $2.11 billion. Its non-GAAP profit of $0.51 per share was 6.7% above analysts’ consensus estimates.
Is now the time to buy Monster? Find out by accessing our full research report, it’s free.
Monster (MNST) Q2 CY2025 Highlights:
- Revenue: $2.11 billion vs analyst estimates of $2.08 billion (11.1% year-on-year growth, 1.4% beat)
- Adjusted EPS: $0.51 vs analyst estimates of $0.48 (6.7% beat)
- Adjusted EBITDA: $678.2 million vs analyst estimates of $625.2 million (32.1% margin, 8.5% beat)
- Operating Margin: 29.9%, up from 27.7% in the same quarter last year
- Free Cash Flow Margin: 16.1%, down from 19.8% in the same quarter last year
- Market Capitalization: $59.29 billion
Hilton H. Schlosberg, Chief Executive Officer, said, “We achieved record net sales for the second quarter, exceeding the $2.0 billion mark for the first time, underscoring the strength of our brands, talent of our team, and continued appeal of our products around the world. The quarter’s performance also reflects the success of our product innovations, which are resonating strongly with consumers.
Company Overview
Founded in 2002 as a natural soda and juice company, Monster Beverage (NASDAQ: MNST) is a pioneer of the energy drink category, and its Monster Energy brand targets a young, active demographic.
Revenue Growth
A company’s long-term performance is an indicator of its overall quality. Any business can put up a good quarter or two, but many enduring ones grow for years.
With $7.66 billion in revenue over the past 12 months, Monster is one of the larger consumer staples companies and benefits from a well-known brand that influences purchasing decisions.
As you can see below, Monster’s 8.4% annualized revenue growth over the last three years was decent. This shows its offerings generated slightly more demand than the average consumer staples company, a helpful starting point for our analysis.
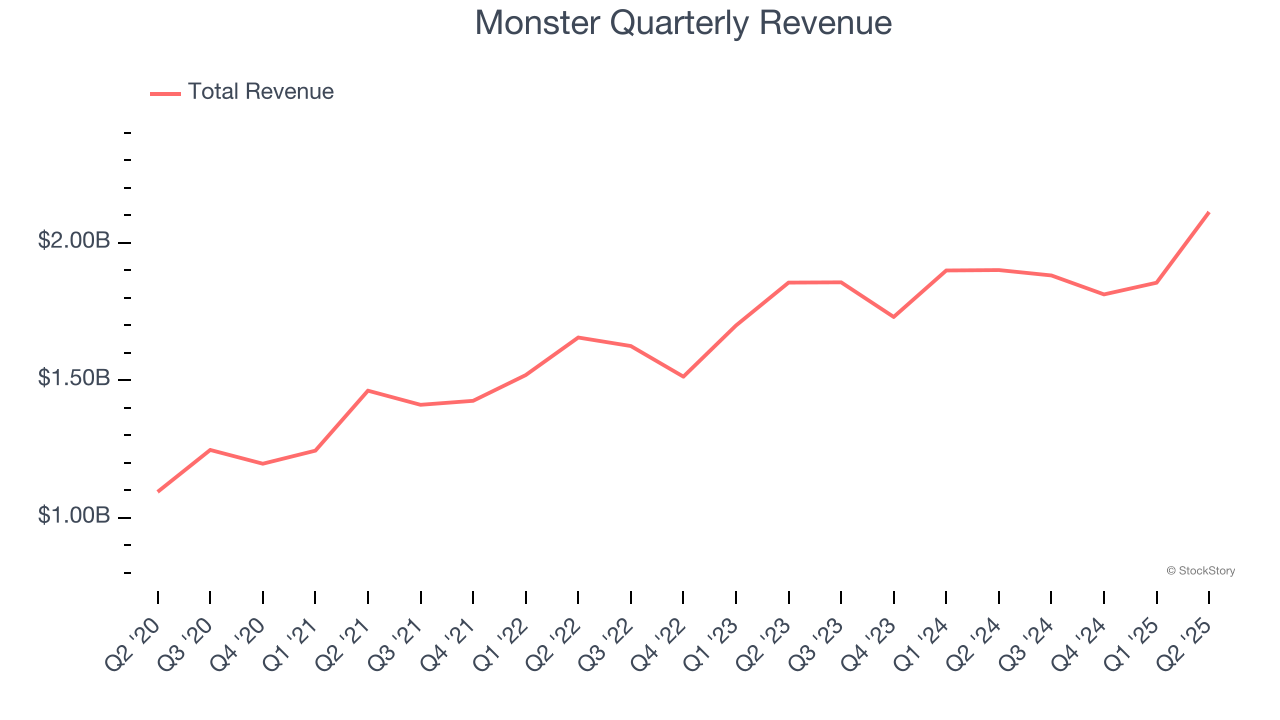
This quarter, Monster reported year-on-year revenue growth of 11.1%, and its $2.11 billion of revenue exceeded Wall Street’s estimates by 1.4%.
Looking ahead, sell-side analysts expect revenue to grow 9.8% over the next 12 months, similar to its three-year rate. This projection is commendable and indicates its newer products will spur better top-line performance.
Today’s young investors won’t have read the timeless lessons in Gorilla Game: Picking Winners In High Technology because it was written more than 20 years ago when Microsoft and Apple were first establishing their supremacy. But if we apply the same principles, then enterprise software stocks leveraging their own generative AI capabilities may well be the Gorillas of the future. So, in that spirit, we are excited to present our Special Free Report on a profitable, fast-growing enterprise software stock that is already riding the automation wave and looking to catch the generative AI next.
Cash Is King
Although earnings are undoubtedly valuable for assessing company performance, we believe cash is king because you can’t use accounting profits to pay the bills.
Monster has shown terrific cash profitability, driven by its lucrative business model that enables it to reinvest, return capital to investors, and stay ahead of the competition. The company’s free cash flow margin was among the best in the consumer staples sector, averaging 21.9% over the last two years.
Taking a step back, we can see that Monster’s margin expanded by 2.1 percentage points over the last year. This shows the company is heading in the right direction, and we can see it became a less capital-intensive business because its free cash flow profitability rose while its operating profitability fell.
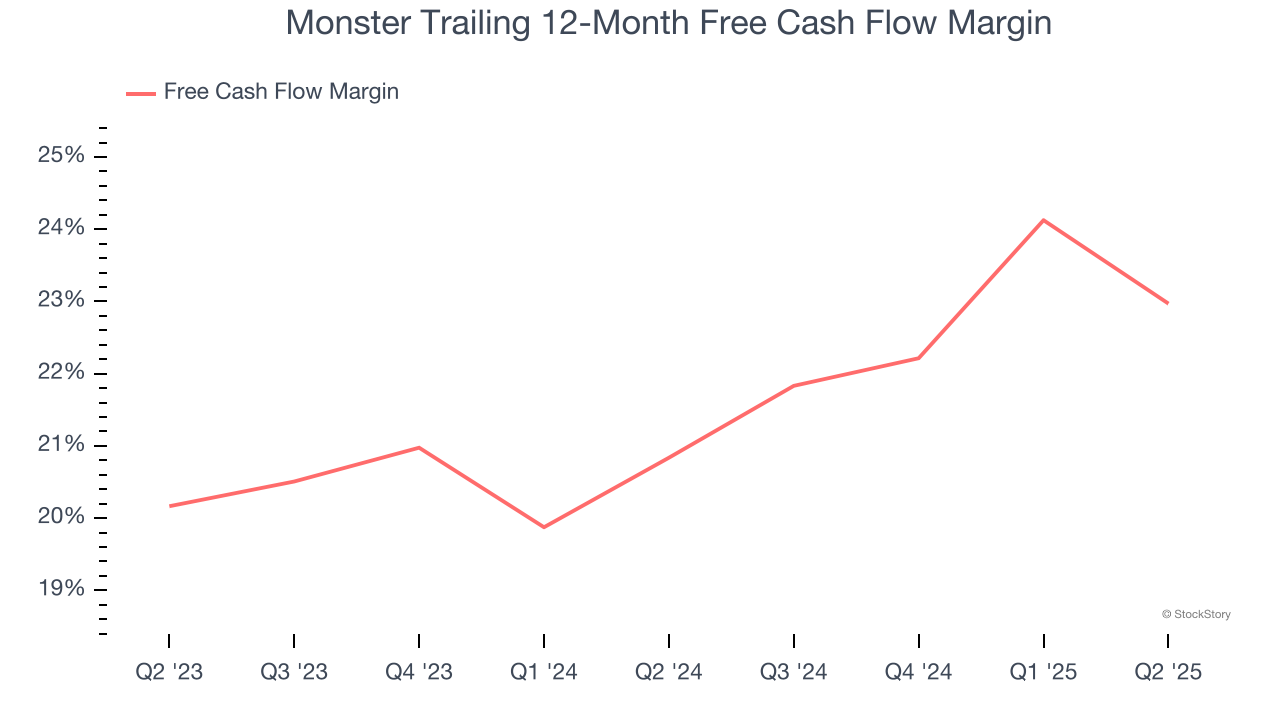
Monster’s free cash flow clocked in at $339 million in Q2, equivalent to a 16.1% margin. The company’s cash profitability regressed as it was 3.8 percentage points lower than in the same quarter last year, but we wouldn’t read too much into it because capital expenditures can be seasonal and companies often stockpile inventory in anticipation of higher demand, leading to quarter-to-quarter swings. Long-term trends carry greater meaning.
Key Takeaways from Monster’s Q2 Results
We were impressed by how significantly Monster blew past analysts’ EBITDA expectations this quarter. We were also happy its adjusted operating income outperformed Wall Street’s estimates. Overall, we think this was a solid quarter with some key areas of upside. The stock traded up 7.1% to $65.15 immediately after reporting.
Monster had an encouraging quarter, but one earnings result doesn’t necessarily make the stock a buy. Let’s see if this is a good investment. The latest quarter does matter, but not nearly as much as longer-term fundamentals and valuation, when deciding if the stock is a buy. We cover that in our actionable full research report which you can read here, it’s free.