
Pet insurance provider Trupanion (NASDAQ: TRUP) reported Q2 CY2025 results topping the market’s revenue expectations, with sales up 12.3% year on year to $353.6 million. Its GAAP profit of $0.22 per share was significantly above analysts’ consensus estimates.
Is now the time to buy Trupanion? Find out by accessing our full research report, it’s free.
Trupanion (TRUP) Q2 CY2025 Highlights:
- Revenue: $353.6 million vs analyst estimates of $349.5 million (12.3% year-on-year growth, 1.1% beat)
- Pre-Tax Profit Margin: 3% (4.9 percentage point year-on-year increase)
- EPS (GAAP): $0.22 vs analyst estimates of -$0.06 (significant beat)
- Market Capitalization: $2.09 billion
“The second quarter was one of the strongest financial quarters in our history, marked by consistent top-line growth, robust margin expansion and strengthening retention,” said Margi Tooth, Chief Executive Officer and President of Trupanion.
Company Overview
Born from a vision to help pet owners avoid economic euthanasia when faced with expensive veterinary bills, Trupanion (NASDAQ: TRUP) provides medical insurance for cats and dogs through data-driven, vertically-integrated products priced specifically for each pet's unique characteristics.
Revenue Growth
Big picture, insurers generate revenue from three key sources. The first is the core business of underwriting policies. The second source is income from investing the “float” (premiums collected upfront not yet paid out as claims) in assets such as fixed-income assets and equities. The third is fees from various sources such as policy administration, annuities, or other value-added services.
Over the last five years, Trupanion grew its revenue at an incredible 25.7% compounded annual growth rate. Its growth beat the average insurance company and shows its offerings resonate with customers, a helpful starting point for our analysis.
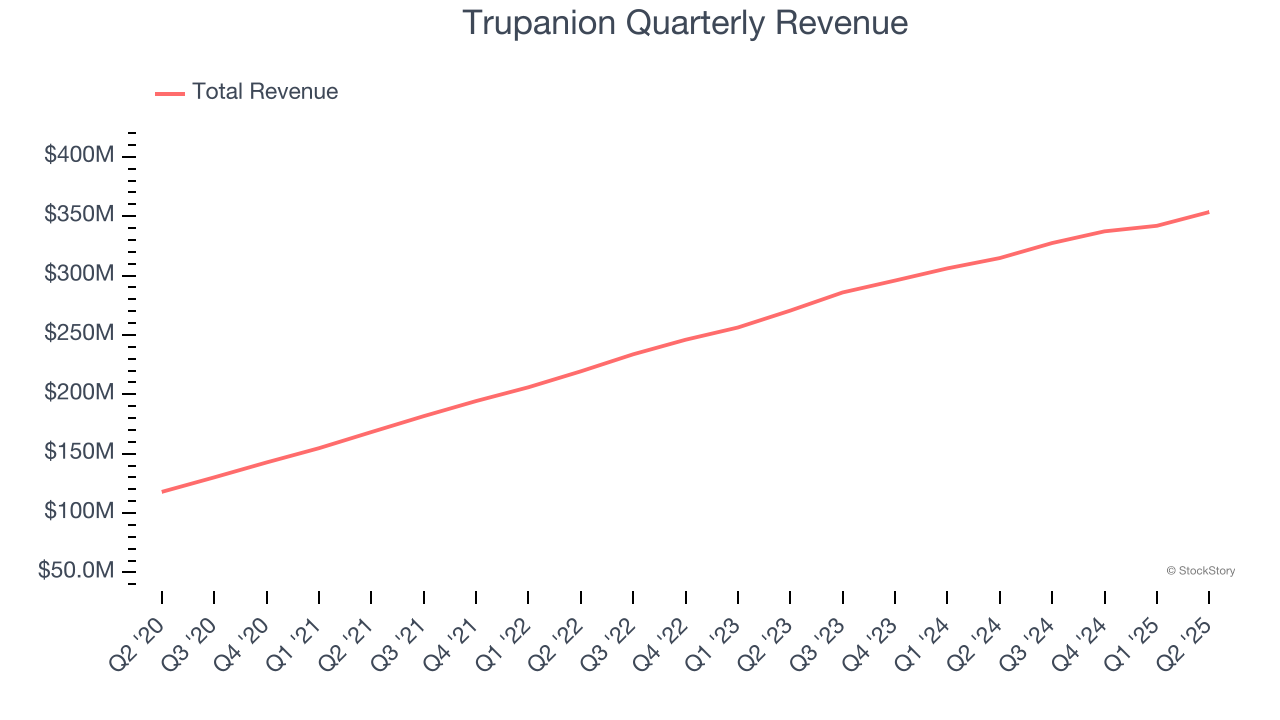
We at StockStory place the most emphasis on long-term growth, but within financials, a half-decade historical view may miss recent interest rate changes, market returns, and industry trends. Trupanion’s annualized revenue growth of 16.2% over the last two years is below its five-year trend, but we still think the results suggest healthy demand. 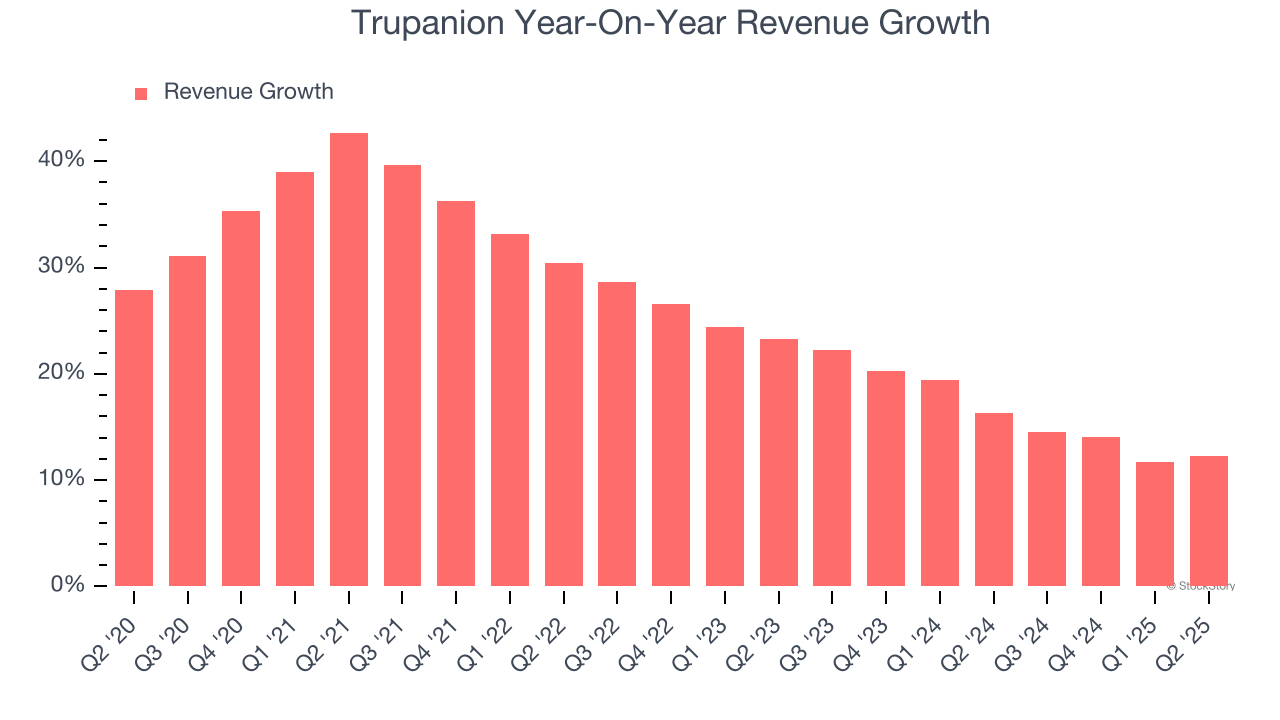
This quarter, Trupanion reported year-on-year revenue growth of 12.3%, and its $353.6 million of revenue exceeded Wall Street’s estimates by 1.1%.
Unless you’ve been living under a rock, it should be obvious by now that generative AI is going to have a huge impact on how large corporations do business. While Nvidia and AMD are trading close to all-time highs, we prefer a lesser-known (but still profitable) stock benefiting from the rise of AI. Click here to access our free report one of our favorites growth stories.
Key Takeaways from Trupanion’s Q2 Results
We were impressed by how significantly Trupanion blew past analysts’ EPS expectations this quarter. We were also happy its revenue narrowly outperformed Wall Street’s estimates. Zooming out, we think this was a solid print. The stock traded up 20.9% to $59 immediately following the results.
Trupanion may have had a good quarter, but does that mean you should invest right now? What happened in the latest quarter matters, but not as much as longer-term business quality and valuation, when deciding whether to invest in this stock. We cover that in our actionable full research report which you can read here, it’s free.


