Let’s dig into the relative performance of Albany (NYSE: AIN) and its peers as we unravel the now-completed Q2 general industrial machinery earnings season.
Automation that increases efficiency and connected equipment that collects analyzable data have been trending, creating new demand for general industrial machinery companies. Those who innovate and create digitized solutions can spur sales and speed up replacement cycles, but all general industrial machinery companies are still at the whim of economic cycles. Consumer spending and interest rates, for example, can greatly impact the industrial production that drives demand for these companies’ offerings.
The 15 general industrial machinery stocks we track reported a satisfactory Q2. As a group, revenues beat analysts’ consensus estimates by 2.3% while next quarter’s revenue guidance was in line.
In light of this news, share prices of the companies have held steady. On average, they are relatively unchanged since the latest earnings results.
Albany (NYSE: AIN)
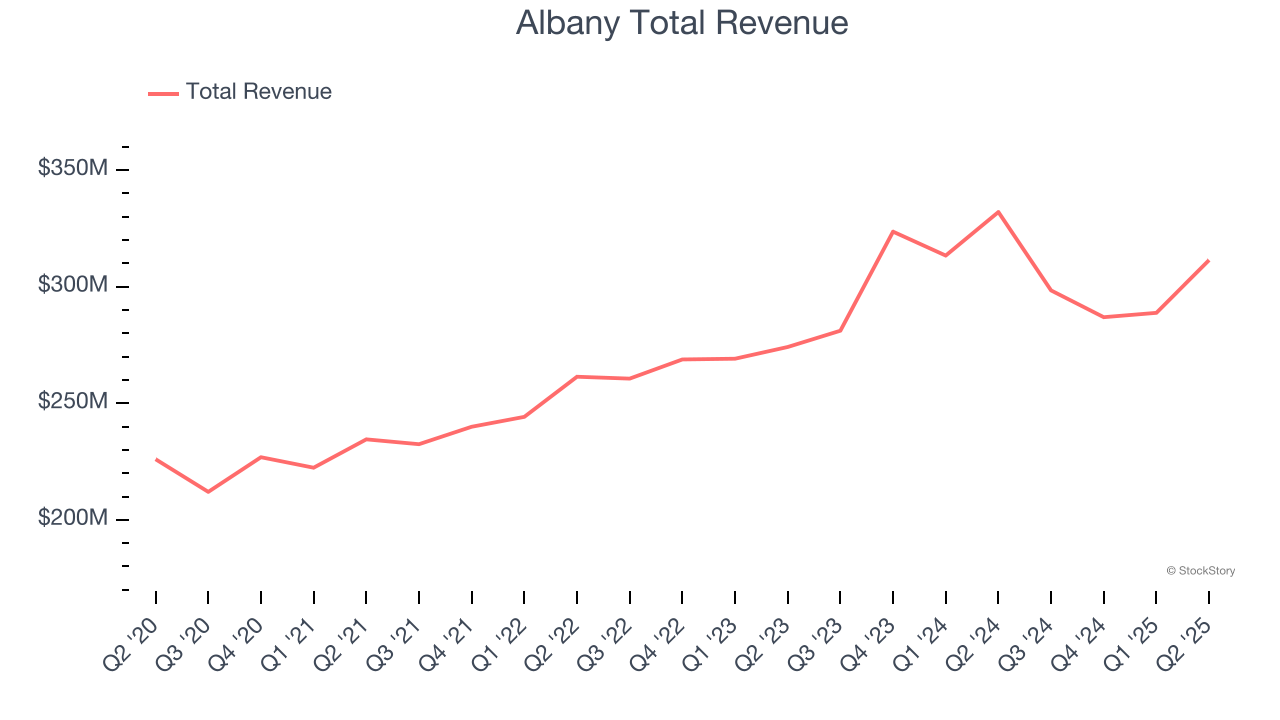
Founded in 1895, Albany (NYSE: AIN) is a global textiles and materials processing company, specializing in machine clothing for paper mills and engineered composite structures for aerospace and other industries.
Albany reported revenues of $311.4 million, down 6.2% year on year. This print exceeded analysts’ expectations by 2.6%. Despite the top-line beat, it was still a slower quarter for the company with a significant miss of analysts’ adjusted operating income estimates.
"Overall, I am encouraged with our progress this year. Our business segment leaders are performing well as they restructure, invest and strengthen their operations. Our second quarter financial results lagged our expectations, but the performance was largely impacted by certain timing and operational issues and we are confident in our recovery," said President and CEO, Gunnar Kleveland.
Unsurprisingly, the stock is down 10.6% since reporting and currently trades at $63.51.
Read our full report on Albany here, it’s free.
Best Q2: Luxfer (NYSE: LXFR)
With its magnesium alloys used in the construction of the famous Spirit of St. Louis aircraft, Luxfer (NYSE: LXFR) offers specialized materials, components, and gas containment devices to various industries.
Luxfer reported revenues of $104 million, up 4.3% year on year, outperforming analysts’ expectations by 5.9%. The business had an incredible quarter with a beat of analysts’ EPS estimates and an impressive beat of analysts’ EBITDA estimates.
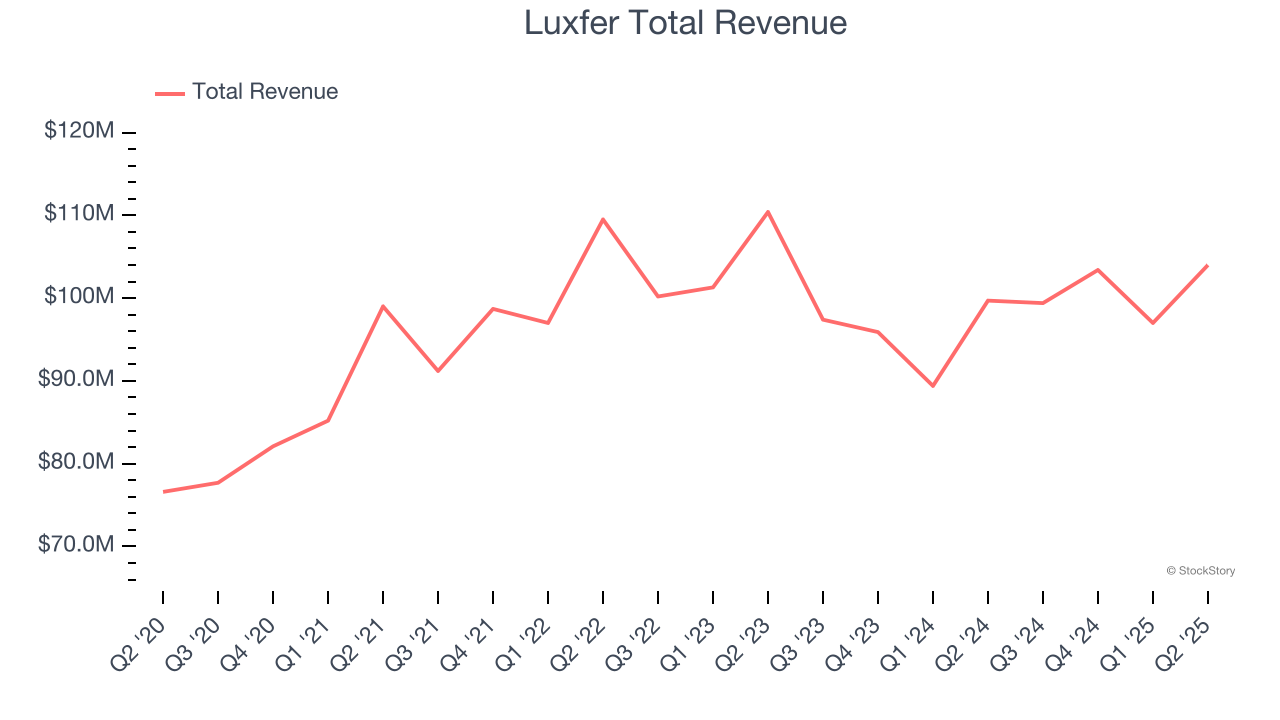
The market seems happy with the results as the stock is up 10.2% since reporting. It currently trades at $13.60.
Is now the time to buy Luxfer? Access our full analysis of the earnings results here, it’s free.
Weakest Q2: Icahn Enterprises (NASDAQ: IEP)
Founded in 1987, Icahn Enterprises (NASDAQ: IEP) is a diversified holding company primarily engaged in investment and asset management across various sectors.
Icahn Enterprises reported revenues of $2.32 billion, up 5.3% year on year, falling short of analysts’ expectations by 3%. It was a disappointing quarter as it posted a significant miss of analysts’ EPS estimates.
Icahn Enterprises delivered the weakest performance against analyst estimates in the group. As expected, the stock is down 4.9% since the results and currently trades at $8.54.
Read our full analysis of Icahn Enterprises’s results here.
3M (NYSE: MMM)
Producers of the first asthma inhaler, 3M Company (NYSE: MMM) is a global conglomerate known for products in industries like healthcare, safety, electronics, and consumer goods.
3M reported revenues of $6.34 billion, up 1.4% year on year. This result beat analysts’ expectations by 4%. Overall, it was a very strong quarter as it also logged full-year EPS guidance exceeding analysts’ expectations and a solid beat of analysts’ adjusted operating income estimates.
The stock is down 1.9% since reporting and currently trades at $156.15.
Read our full, actionable report on 3M here, it’s free.
John Bean (NYSE: JBTM)
Tracing back to its invention of the mechanical milk bottle filler in 1884, John Bean (NYSE: JBT) designs, manufactures, and sells equipment used for food processing and aviation.
John Bean reported revenues of $934.8 million, up 132% year on year. This number topped analysts’ expectations by 4.9%. It was a strong quarter as it also put up a solid beat of analysts’ EBITDA estimates and a beat of analysts’ EPS estimates.
John Bean pulled off the fastest revenue growth among its peers. The stock is up 7.2% since reporting and currently trades at $143.29.
Read our full, actionable report on John Bean here, it’s free.
Market Update
The Fed’s interest rate hikes throughout 2022 and 2023 have successfully cooled post-pandemic inflation, bringing it closer to the 2% target. Inflationary pressures have eased without tipping the economy into a recession, suggesting a soft landing. This stability, paired with recent rate cuts (0.5% in September 2024 and 0.25% in November 2024), fueled a strong year for the stock market in 2024. The markets surged further after Donald Trump’s presidential victory in November, with major indices reaching record highs in the days following the election. Still, questions remain about the direction of economic policy, as potential tariffs and corporate tax changes add uncertainty for 2025.
Want to invest in winners with rock-solid fundamentals? Check out our 9 Best Market-Beating Stocks and add them to your watchlist. These companies are poised for growth regardless of the political or macroeconomic climate.
StockStory is growing and hiring equity analyst and marketing roles. Are you a 0 to 1 builder passionate about the markets and AI? See the open roles here.