As the Q2 earnings season comes to a close, it’s time to take stock of this quarter’s best and worst performers in the electrical systems industry, including Hubbell (NYSE: HUBB) and its peers.
Like many equipment and component manufacturers, electrical systems companies are buoyed by secular trends such as connectivity and industrial automation. More specific pockets of strong demand include Internet of Things (IoT) connectivity and the 5G telecom upgrade cycle, which can benefit companies whose cables and conduits fit those needs. But like the broader industrials sector, these companies are also at the whim of economic cycles. Interest rates, for example, can greatly impact projects that drive demand for these products.
The 12 electrical systems stocks we track reported a strong Q2. As a group, revenues beat analysts’ consensus estimates by 2.1% while next quarter’s revenue guidance was 2.4% below.
Thankfully, share prices of the companies have been resilient as they are up 5.8% on average since the latest earnings results.
Hubbell (NYSE: HUBB)
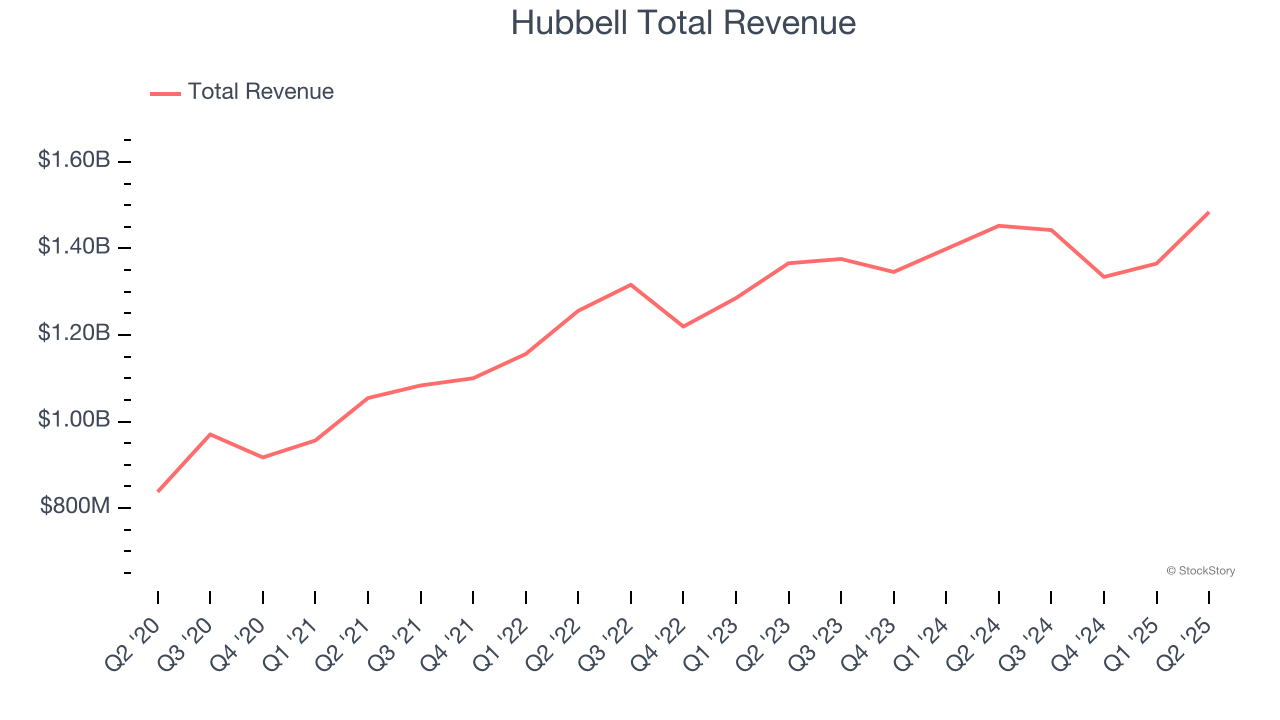
A respected player in the electrical segment, Hubbell (NYSE: HUBB) manufactures electronic products for the construction, industrial, utility, and telecommunications markets.
Hubbell reported revenues of $1.48 billion, up 2.2% year on year. This print fell short of analysts’ expectations by 1.9%, but it was still a strong quarter for the company with an impressive beat of analysts’ EBITDA estimates and a solid beat of analysts’ adjusted operating income estimates.
“Hubbell delivered double digit adjusted earnings per share growth in the second quarter, driven by strong organic growth in Grid Infrastructure and Electrical Solutions, as well as year-over-year margin expansion” said Gerben Bakker, Chairman, President and CEO.
Unsurprisingly, the stock is down 1.6% since reporting and currently trades at $430.99.
We think Hubbell is a good business, but is it a buy today? Read our full report here, it’s free.
Best Q2: LSI (NASDAQ: LYTS)
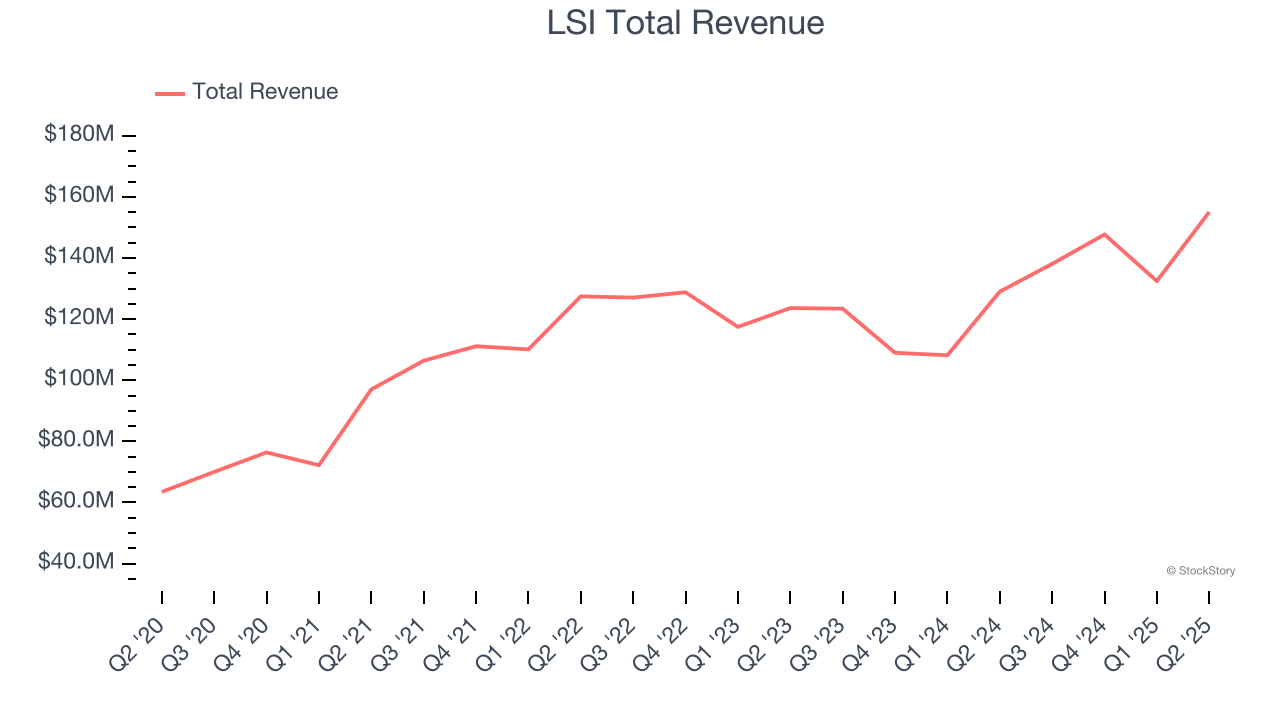
Enhancing commercial environments, LSI (NASDAQ: LYTS) provides lighting and display solutions for businesses and retailers.
LSI reported revenues of $155.1 million, up 20.2% year on year, outperforming analysts’ expectations by 11.6%. The business had an incredible quarter with a beat of analysts’ EPS estimates and an impressive beat of analysts’ EBITDA estimates.
The market seems happy with the results as the stock is up 18.8% since reporting. It currently trades at $22.93.
Is now the time to buy LSI? Access our full analysis of the earnings results here, it’s free.
Weakest Q2: Whirlpool (NYSE: WHR)
Credited with introducing the first automatic washing machine, Whirlpool (NYSE: WHR) is a manufacturer of a variety of home appliances.
Whirlpool reported revenues of $3.77 billion, down 5.4% year on year, falling short of analysts’ expectations by 3%. It was a softer quarter as it posted full-year EPS guidance missing analysts’ expectations significantly and a significant miss of analysts’ adjusted operating income estimates.
As expected, the stock is down 4.1% since the results and currently trades at $93.85.
Read our full analysis of Whirlpool’s results here.
Allegion (NYSE: ALLE)
Allegion plc (NYSE: ALLE) is a provider of security products and solutions that keep people and assets safe and secure in various environments.
Allegion reported revenues of $1.02 billion, up 5.8% year on year. This result beat analysts’ expectations by 1.5%. Overall, it was a very strong quarter as it also put up full-year EPS guidance exceeding analysts’ expectations and an impressive beat of analysts’ adjusted operating income estimates.
The stock is up 10% since reporting and currently trades at $169.80.
Read our full, actionable report on Allegion here, it’s free.
Sanmina (NASDAQ: SANM)
Founded in 1980, Sanmina (NASDAQ: SANM) is an electronics manufacturing services company offering end-to-end solutions for various industries.
Sanmina reported revenues of $2.04 billion, up 10.9% year on year. This print topped analysts’ expectations by 3.1%. Aside from that, it was a mixed quarter as it also produced an impressive beat of analysts’ adjusted operating income estimates but a significant miss of analysts’ EBITDA estimates.
The stock is up 19.6% since reporting and currently trades at $117.52.
Read our full, actionable report on Sanmina here, it’s free.
Market Update
The Fed’s interest rate hikes throughout 2022 and 2023 have successfully cooled post-pandemic inflation, bringing it closer to the 2% target. Inflationary pressures have eased without tipping the economy into a recession, suggesting a soft landing. This stability, paired with recent rate cuts (0.5% in September 2024 and 0.25% in November 2024), fueled a strong year for the stock market in 2024. The markets surged further after Donald Trump’s presidential victory in November, with major indices reaching record highs in the days following the election. Still, questions remain about the direction of economic policy, as potential tariffs and corporate tax changes add uncertainty for 2025.
Want to invest in winners with rock-solid fundamentals? Check out our 9 Best Market-Beating Stocks and add them to your watchlist. These companies are poised for growth regardless of the political or macroeconomic climate.
StockStory is growing and hiring equity analyst and marketing roles. Are you a 0 to 1 builder passionate about the markets and AI? See the open roles here.