
Wix has been treading water for the past six months, recording a small loss of 1.4% while holding steady at $167.93. The stock also fell short of the S&P 500’s 16% gain during that period.
Is there a buying opportunity in Wix, or does it present a risk to your portfolio? Get the full breakdown from our expert analysts, it’s free.
Why Is Wix Not Exciting?
We're cautious about Wix. Here are two reasons there are better opportunities than WIX and a stock we'd rather own.
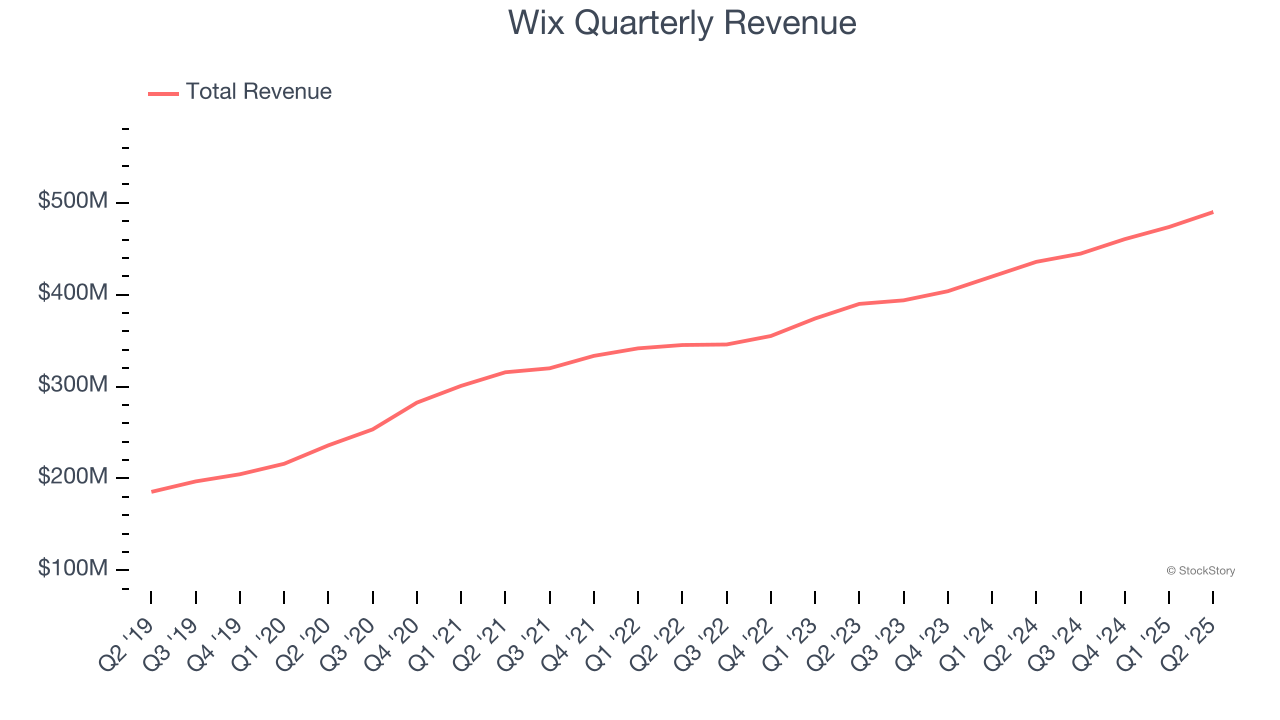
1. Long-Term Revenue Growth Disappoints
Reviewing a company’s long-term sales performance reveals insights into its quality. Any business can experience short-term success, but top-performing ones enjoy sustained growth for years. Over the last three years, Wix grew its sales at a 11.7% annual rate. Although this growth is acceptable on an absolute basis, it fell short of our standards for the software sector, which enjoys a number of secular tailwinds.
2. Low Gross Margin Hinders Flexibility
For software companies like Wix, gross profit tells us how much money remains after paying for the base cost of products and services (typically servers, licenses, and certain personnel). These costs are usually low as a percentage of revenue, explaining why software is more lucrative than other sectors.
Wix’s gross margin is slightly below the average software company, giving it less room than its competitors to invest in areas such as product and sales. As you can see below, it averaged a 68.4% gross margin over the last year. That means Wix paid its providers a lot of money ($31.61 for every $100 in revenue) to run its business. 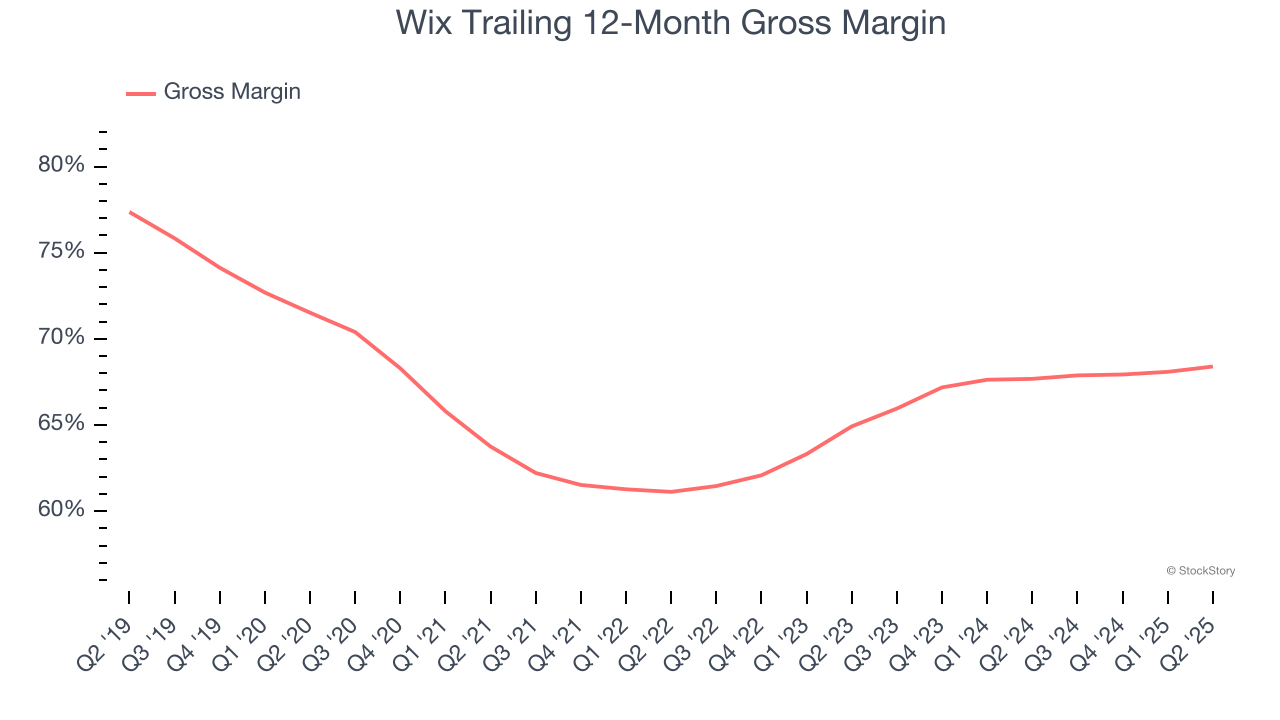
Final Judgment
Wix’s business quality ultimately falls short of our standards. With its shares underperforming the market lately, the stock trades at 4.7× forward price-to-sales (or $167.93 per share). This valuation is reasonable, but the company’s shakier fundamentals present too much downside risk. We're pretty confident there are more exciting stocks to buy at the moment. We’d recommend looking at a safe-and-steady industrials business benefiting from an upgrade cycle.
High-Quality Stocks for All Market Conditions
When Trump unveiled his aggressive tariff plan in April 2025, markets tanked as investors feared a full-blown trade war. But those who panicked and sold missed the subsequent rebound that’s already erased most losses.
Don’t let fear keep you from great opportunities and take a look at Top 5 Growth Stocks for this month. This is a curated list of our High Quality stocks that have generated a market-beating return of 183% over the last five years (as of March 31st 2025).
Stocks that made our list in 2020 include now familiar names such as Nvidia (+1,545% between March 2020 and March 2025) as well as under-the-radar businesses like the once-small-cap company Exlservice (+354% five-year return). Find your next big winner with StockStory today.
StockStory is growing and hiring equity analyst and marketing roles. Are you a 0 to 1 builder passionate about the markets and AI? See the open roles here.