Over the past six months, Hub Group’s shares (currently trading at $36.41) have posted a disappointing 5.4% loss, well below the S&P 500’s 16% gain. This was partly driven by its softer quarterly results and may have investors wondering how to approach the situation.
Is now the time to buy Hub Group, or should you be careful about including it in your portfolio? Get the full stock story straight from our expert analysts, it’s free.
Why Do We Think Hub Group Will Underperform?
Despite the more favorable entry price, we're swiping left on Hub Group for now. Here are three reasons why HUBG doesn't excite us and a stock we'd rather own.
1. Sales Volumes Stall, Demand Waning
Revenue growth can be broken down into changes in price and volume (the number of units sold). While both are important, volume is the lifeblood of a successful Air Freight and Logistics company because there’s a ceiling to what customers will pay.
Over the last two years, Hub Group failed to grow its units sold. This performance was underwhelming and implies there may be increasing competition or market saturation. It also suggests Hub Group might have to lower prices or invest in product improvements to accelerate growth, factors that can hinder near-term profitability. 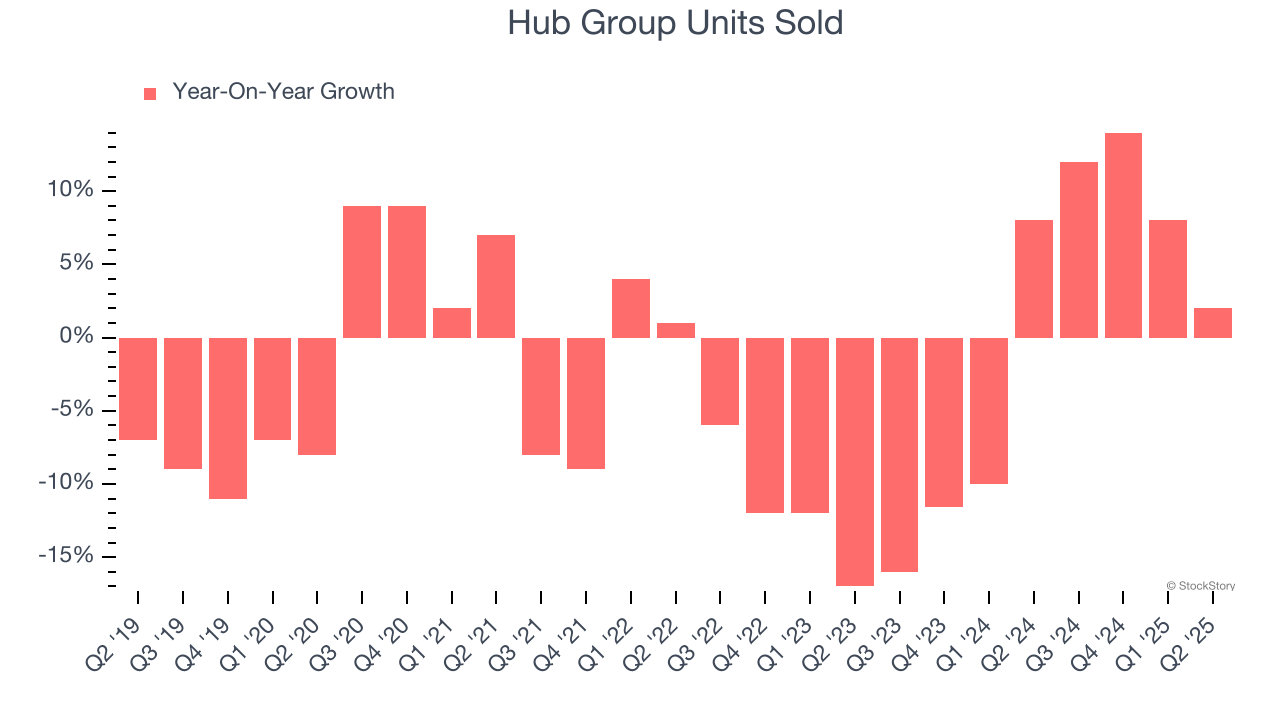
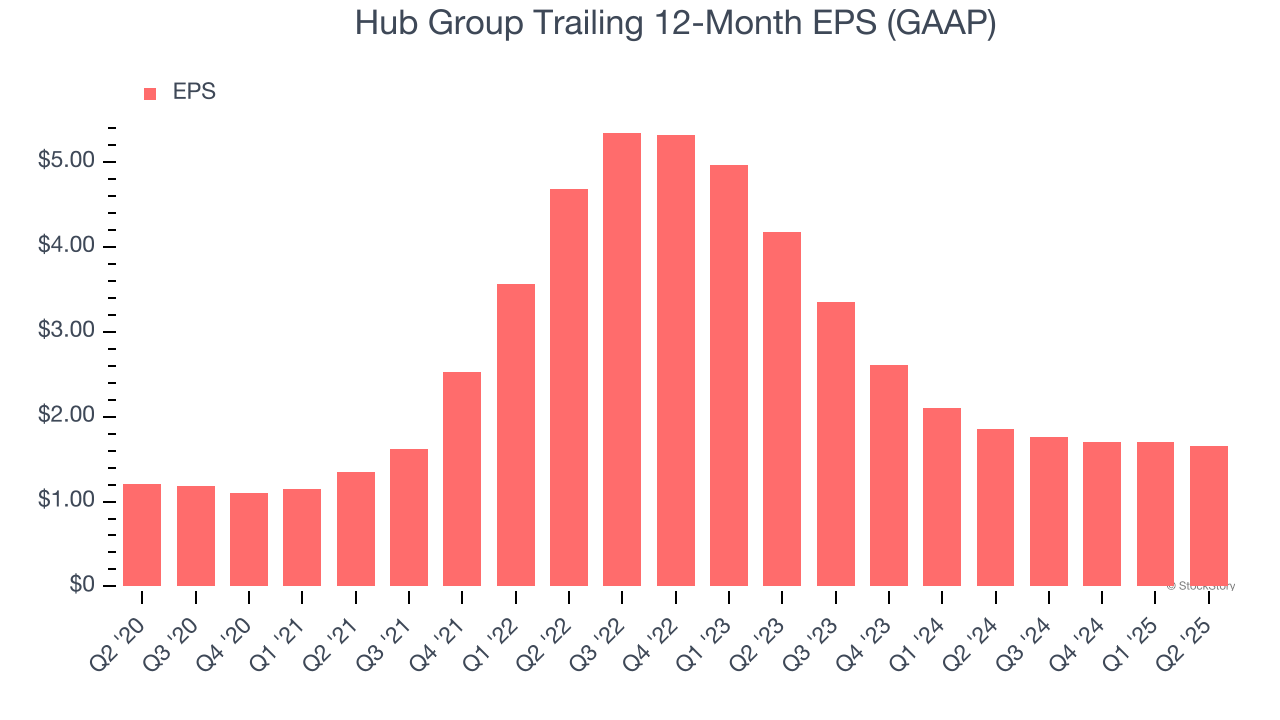
2. EPS Barely Growing
We track the long-term change in earnings per share (EPS) because it highlights whether a company’s growth is profitable.
Hub Group’s EPS grew at an unimpressive 6.5% compounded annual growth rate over the last five years. On the bright side, this performance was better than its 2% annualized revenue growth and tells us the company became more profitable on a per-share basis as it expanded.
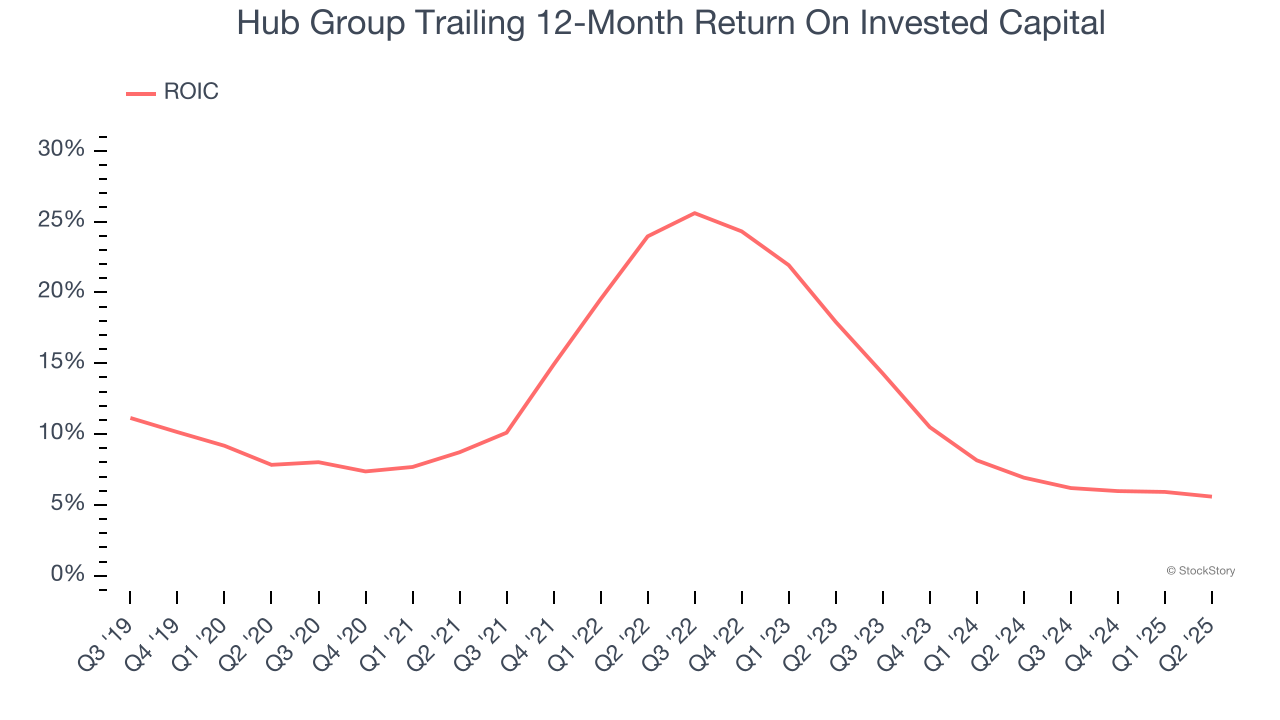
3. New Investments Fail to Bear Fruit as ROIC Declines
A company’s ROIC, or return on invested capital, shows how much operating profit it makes compared to the money it has raised (debt and equity).
We like to invest in businesses with high returns, but the trend in a company’s ROIC is what often surprises the market and moves the stock price. Over the last few years, Hub Group’s ROIC has unfortunately decreased significantly. We like what management has done in the past, but its declining returns are perhaps a symptom of fewer profitable growth opportunities.
Final Judgment
Hub Group doesn’t pass our quality test. After the recent drawdown, the stock trades at 17.1× forward P/E (or $36.41 per share). While this valuation is reasonable, we don’t see a big opportunity at the moment. There are better investments elsewhere. We’d recommend looking at the most dominant software business in the world.
High-Quality Stocks for All Market Conditions
When Trump unveiled his aggressive tariff plan in April 2025, markets tanked as investors feared a full-blown trade war. But those who panicked and sold missed the subsequent rebound that’s already erased most losses.
Don’t let fear keep you from great opportunities and take a look at Top 5 Growth Stocks for this month. This is a curated list of our High Quality stocks that have generated a market-beating return of 183% over the last five years (as of March 31st 2025).
Stocks that made our list in 2020 include now familiar names such as Nvidia (+1,545% between March 2020 and March 2025) as well as under-the-radar businesses like the once-small-cap company Comfort Systems (+782% five-year return). Find your next big winner with StockStory today.
StockStory is growing and hiring equity analyst and marketing roles. Are you a 0 to 1 builder passionate about the markets and AI? See the open roles here.