Since September 2020, the S&P 500 has delivered a total return of 94.8%. But one standout stock has doubled the market - over the past five years, Natera has surged 186% to $176.64 per share. Its momentum hasn’t stopped as it’s also gained 33.2% in the last six months thanks to its solid quarterly results, beating the S&P by 17.2%.
Is it too late to buy NTRA? Find out in our full research report, it’s free.
Why Is NTRA a Good Business?
Founded in 2003 as Gene Security Network before rebranding in 2012, Natera (NASDAQ: NTRA) develops and commercializes genetic tests for prenatal screening, cancer detection, and organ transplant monitoring using its proprietary cell-free DNA technology.
1. Elevated Demand Drives Higher Sales Volumes
Revenue growth can be broken down into changes in price and volume (the number of units sold). While both are important, volume is the lifeblood of a successful Immuno-Oncology company because there’s a ceiling to what customers will pay.
Natera’s tests processed punched in at 799,900 in the latest quarter, and over the last two years, averaged 21% year-on-year growth. This performance was fantastic and shows its offerings have a unique value proposition (and perhaps some degree of customer loyalty). 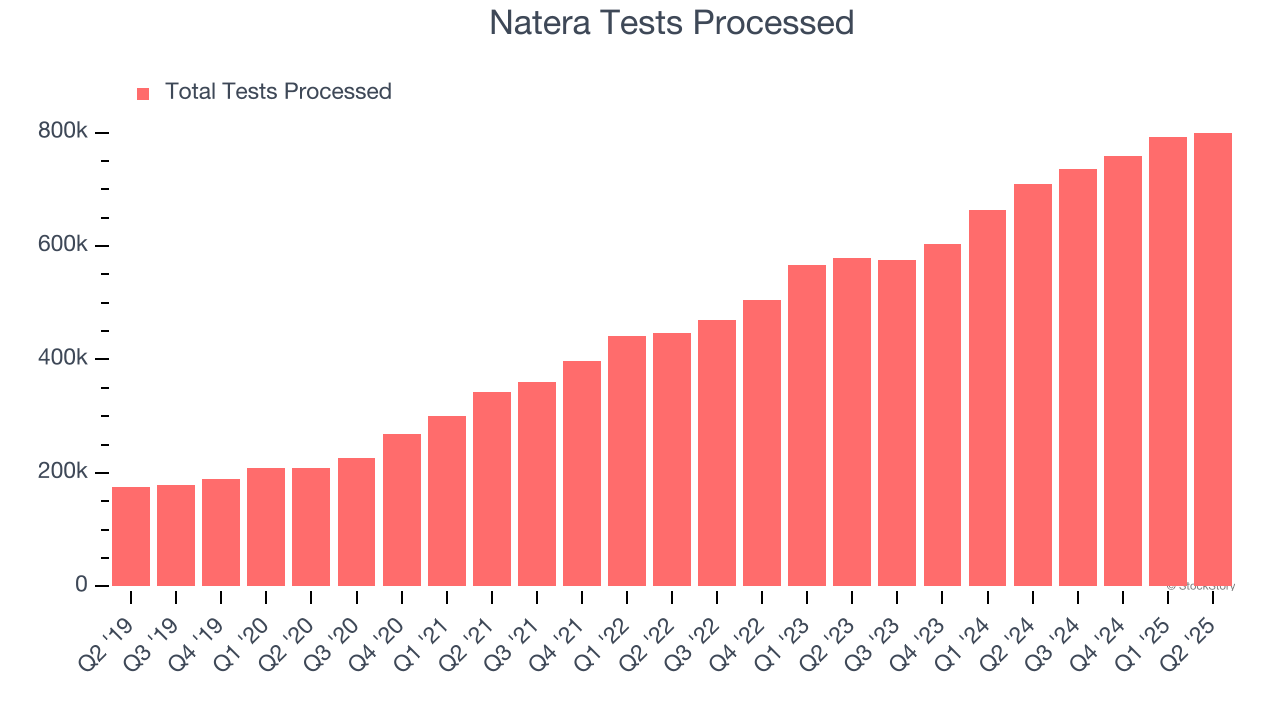
2. Adjusted Operating Margin Rising, Profits Up
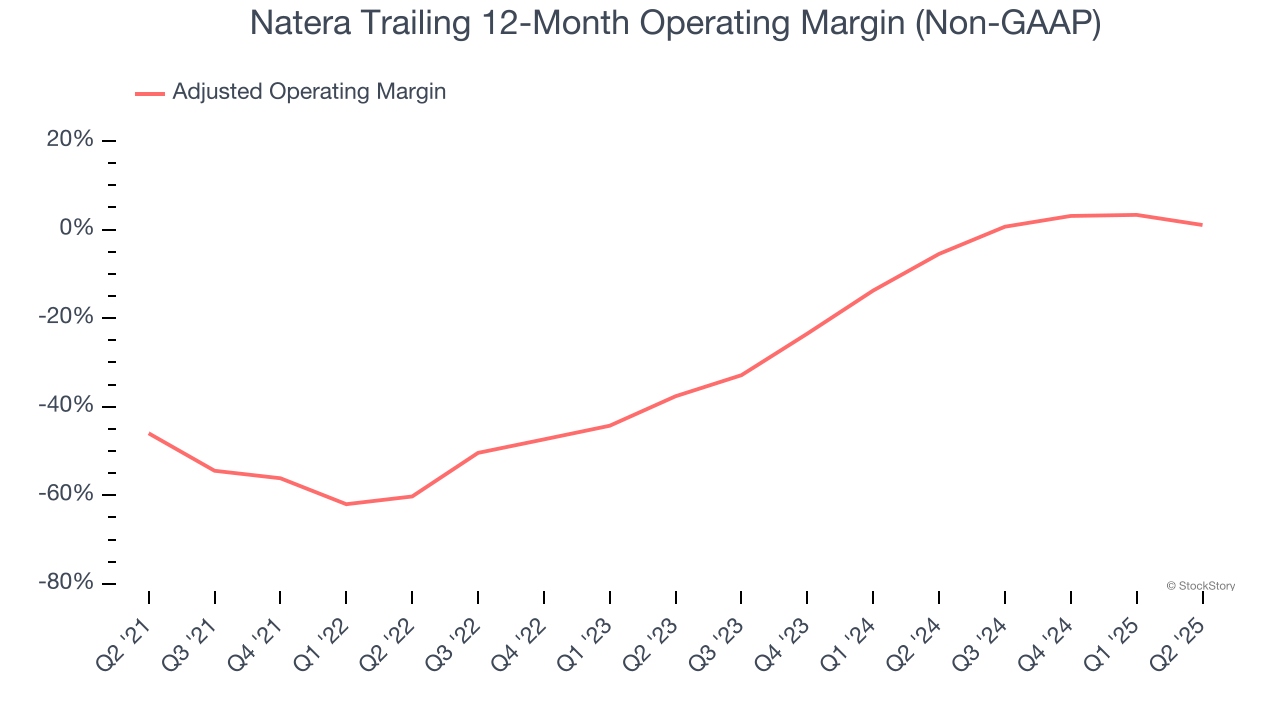
Adjusted operating margin is one of the best measures of profitability because it tells us how much money a company takes home after subtracting all core expenses, like marketing and R&D. It also removes various one-time costs to paint a better picture of normalized profits.
Natera’s adjusted operating margin rose by 38.7 percentage points over the last two years, as its sales growth gave it operating leverage. Its adjusted operating margin for the trailing 12 months was 1%.
3. Increasing Free Cash Flow Margin Juices Financials
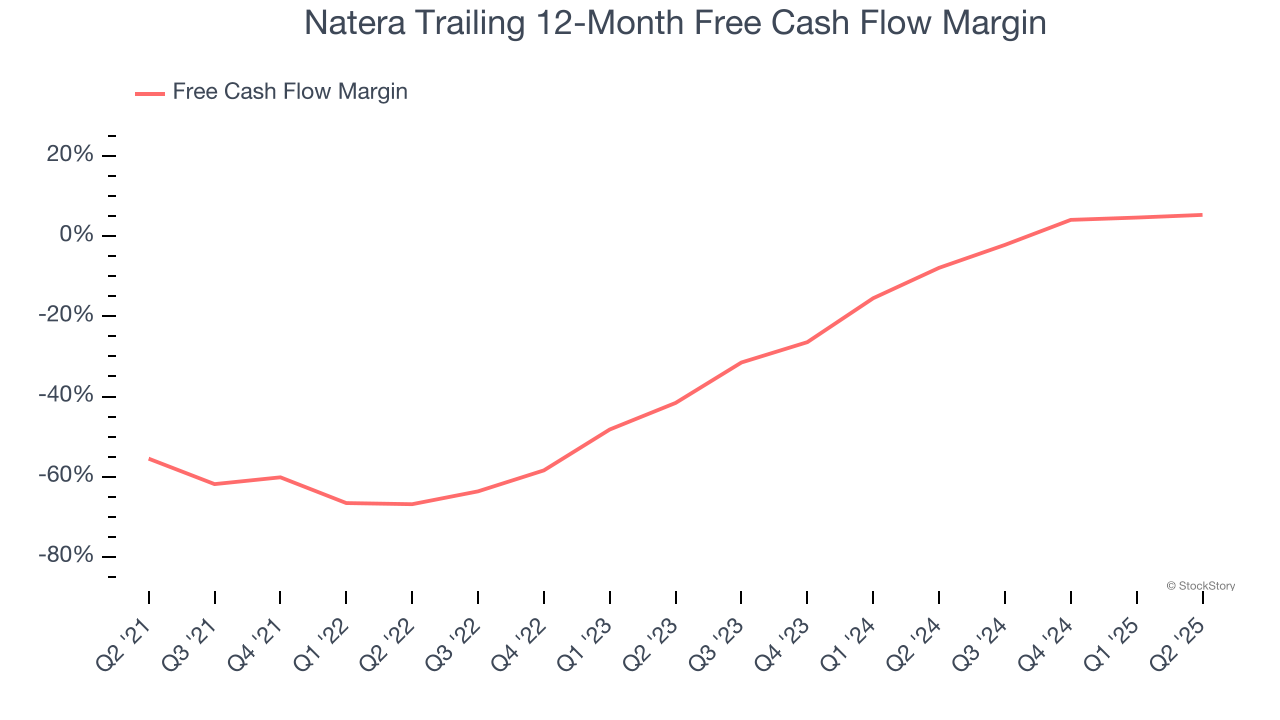
If you’ve followed StockStory for a while, you know we emphasize free cash flow. Why, you ask? We believe that in the end, cash is king, and you can’t use accounting profits to pay the bills.
As you can see below, Natera’s margin expanded by 60.8 percentage points over the last five years. Natera’s free cash flow margin for the trailing 12 months was 5.3%.
Final Judgment
These are just a few reasons why we think Natera is a great business, and with its shares beating the market recently, the stock trades at $176.64 per share (or a forward price-to-sales ratio of 10.8×). Is now the time to initiate a position? See for yourself in our comprehensive research report, it’s free.
High-Quality Stocks for All Market Conditions
Donald Trump’s April 2025 "Liberation Day" tariffs sent markets into a tailspin, but stocks have since rebounded strongly, proving that knee-jerk reactions often create the best buying opportunities.
The smart money is already positioning for the next leg up. Don’t miss out on the recovery - check out our Top 5 Strong Momentum Stocks for this week. This is a curated list of our High Quality stocks that have generated a market-beating return of 183% over the last five years (as of March 31st 2025).
Stocks that made our list in 2020 include now familiar names such as Nvidia (+1,545% between March 2020 and March 2025) as well as under-the-radar businesses like the once-micro-cap company Tecnoglass (+1,754% five-year return). Find your next big winner with StockStory today.
StockStory is growing and hiring equity analyst and marketing roles. Are you a 0 to 1 builder passionate about the markets and AI? See the open roles here.