Even though Tecnoglass (currently trading at $71.47 per share) has gained 10.4% over the last six months, it has lagged the S&P 500’s 17.4% return during that period. This may have investors wondering how to approach the situation.
Is TGLS a buy right now? Or is its underperformance reflective of its business quality?
Why Does Tecnoglass Spark Debate?
The first-ever Colombian company to trade on the NASDAQ, Tecnoglass (NYSE: TGLS) is a manufacturer of architectural glass, windows, and aluminum products.
Two Positive Attributes:
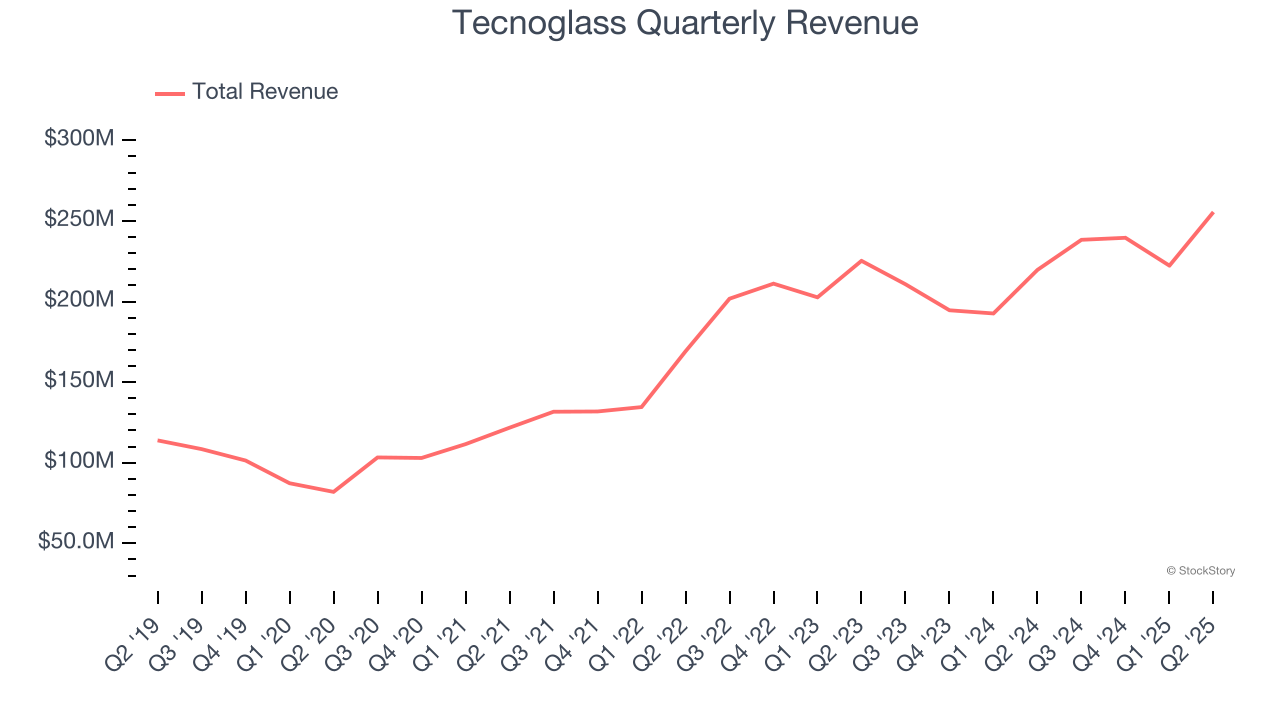
1. Skyrocketing Revenue Shows Strong Momentum
A company’s long-term sales performance is one signal of its overall quality. Any business can experience short-term success, but top-performing ones enjoy sustained growth for years. Thankfully, Tecnoglass’s 20.3% annualized revenue growth over the last five years was incredible. Its growth surpassed the average industrials company and shows its offerings resonate with customers.
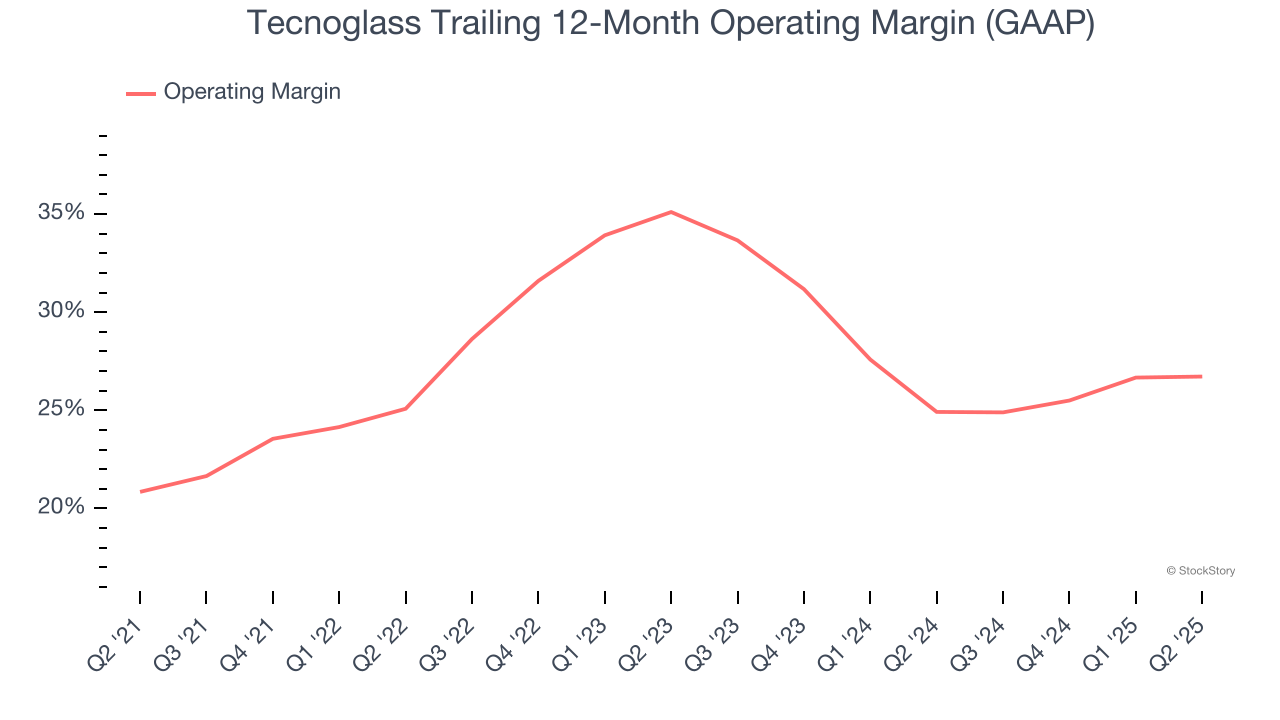
2. Operating Margin Reveals a Well-Run Organization
Operating margin is one of the best measures of profitability because it tells us how much money a company takes home after procuring and manufacturing its products, marketing and selling those products, and most importantly, keeping them relevant through research and development.
Tecnoglass has been a well-oiled machine over the last five years. It demonstrated elite profitability for an industrials business, boasting an average operating margin of 27.3%. This result isn’t surprising as its high gross margin gives it a favorable starting point.
One Reason to be Careful:
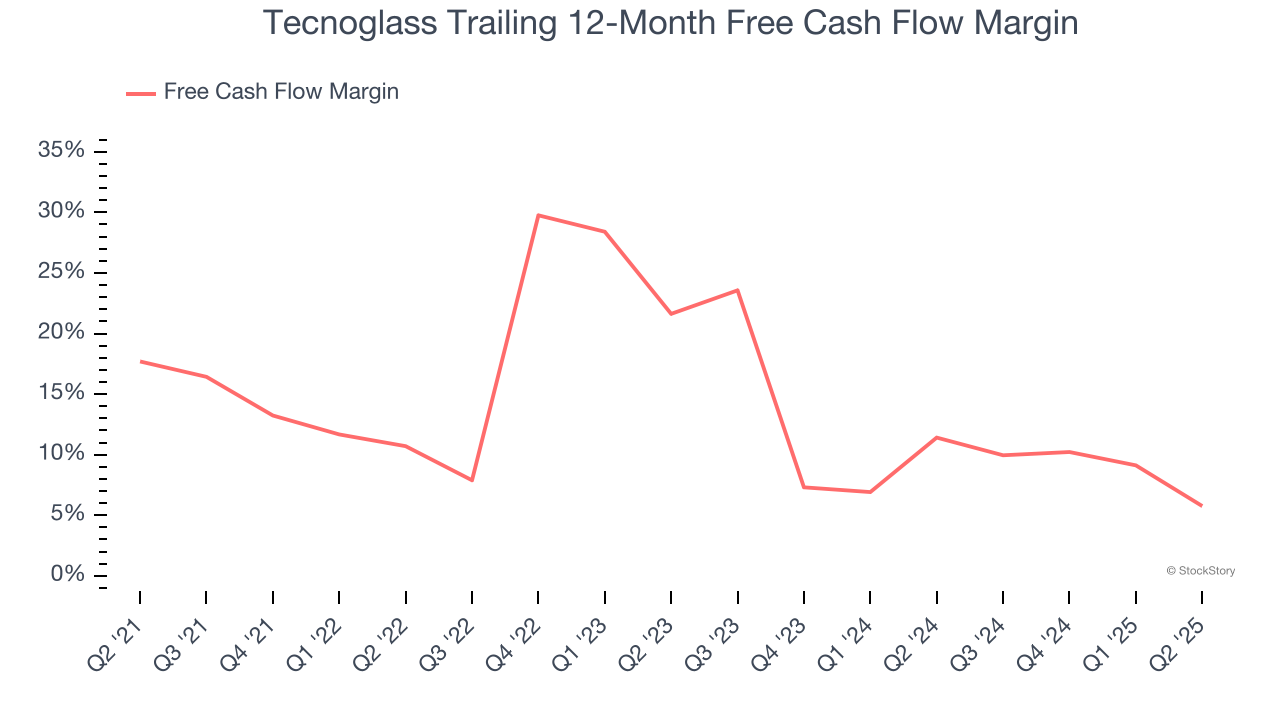
Free Cash Flow Margin Dropping
Free cash flow isn't a prominently featured metric in company financials and earnings releases, but we think it's telling because it accounts for all operating and capital expenses, making it tough to manipulate. Cash is king.
As you can see below, Tecnoglass’s margin dropped by 11.9 percentage points over the last five years. If its declines continue, it could signal increasing investment needs and capital intensity. Tecnoglass’s free cash flow margin for the trailing 12 months was 5.8%.
Final Judgment
Tecnoglass’s positive characteristics outweigh the negatives. With its shares trailing the market in recent months, the stock trades at 15.9× forward P/E (or $71.47 per share). Is now the right time to buy? See for yourself in our in-depth research report, it’s free.
High-Quality Stocks for All Market Conditions
Trump’s April 2025 tariff bombshell triggered a massive market selloff, but stocks have since staged an impressive recovery, leaving those who panic sold on the sidelines.
Take advantage of the rebound by checking out our Top 6 Stocks for this week. This is a curated list of our High Quality stocks that have generated a market-beating return of 183% over the last five years (as of March 31st 2025).
Stocks that made our list in 2020 include now familiar names such as Nvidia (+1,545% between March 2020 and March 2025) as well as under-the-radar businesses like the once-micro-cap company Kadant (+351% five-year return). Find your next big winner with StockStory today.
StockStory is growing and hiring equity analyst and marketing roles. Are you a 0 to 1 builder passionate about the markets and AI? See the open roles here.