
Luxury furniture retailer RH (NYSE: RH) met Wall Street’s revenue expectations in Q2 CY2025, with sales up 8.4% year on year to $899.2 million. On the other hand, next quarter’s revenue guidance of $884.8 million was less impressive, coming in 2% below analysts’ estimates. Its non-GAAP profit of $2.93 per share was 8.9% below analysts’ consensus estimates.
Is now the time to buy RH? Find out by accessing our full research report, it’s free.
RH (RH) Q2 CY2025 Highlights:
- Revenue: $899.2 million vs analyst estimates of $903 million (8.4% year-on-year growth, in line)
- Adjusted EPS: $2.93 vs analyst expectations of $3.22 (8.9% miss)
- Adjusted EBITDA: $185.1 million vs analyst estimates of $191.5 million (20.6% margin, 3.3% miss)
- Revenue Guidance for Q3 CY2025 is $884.8 million at the midpoint, below analyst estimates of $902.6 million
- Operating Margin: 14.3%, up from 11.6% in the same quarter last year
- Free Cash Flow was $80.68 million, up from -$37.9 million in the same quarter last year
- Market Capitalization: $4.29 billion
Company Overview
Formerly known as Restoration Hardware, RH (NYSE: RH) is a specialty retailer that exclusively sells its own brand of high-end furniture and home decor.
Revenue Growth
A company’s long-term performance is an indicator of its overall quality. Any business can put up a good quarter or two, but the best consistently grow over the long haul.
With $3.34 billion in revenue over the past 12 months, RH is a small retailer, which sometimes brings disadvantages compared to larger competitors benefiting from economies of scale and negotiating leverage with suppliers.
As you can see below, RH’s sales grew at a sluggish 4.2% compounded annual growth rate over the last six years (we compare to 2019 to normalize for COVID-19 impacts).
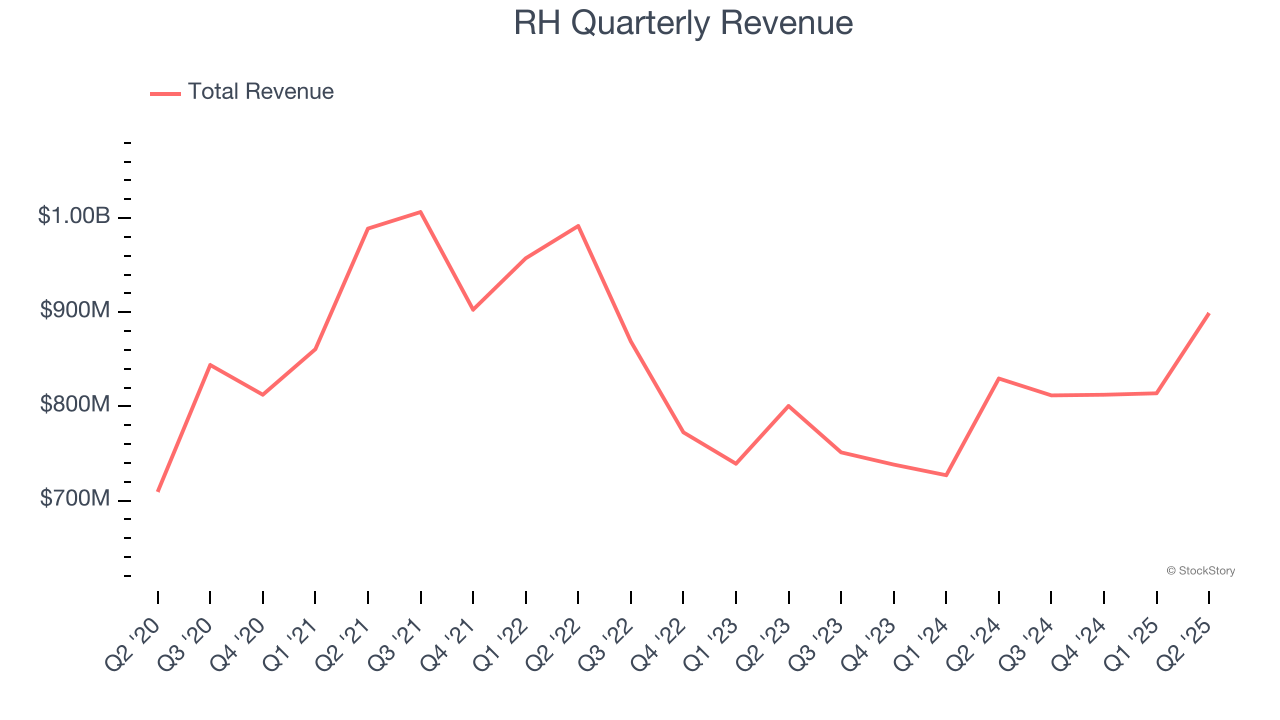
This quarter, RH grew its revenue by 8.4% year on year, and its $899.2 million of revenue was in line with Wall Street’s estimates. Company management is currently guiding for a 9% year-on-year increase in sales next quarter.
Looking further ahead, sell-side analysts expect revenue to grow 10.9% over the next 12 months, an acceleration versus the last six years. This projection is eye-popping and indicates its newer products will spur better top-line performance.
Unless you’ve been living under a rock, it should be obvious by now that generative AI is going to have a huge impact on how large corporations do business. While Nvidia and AMD are trading close to all-time highs, we prefer a lesser-known (but still profitable) stock benefiting from the rise of AI. Click here to access our free report one of our favorites growth stories.
Store Performance
Number of Stores
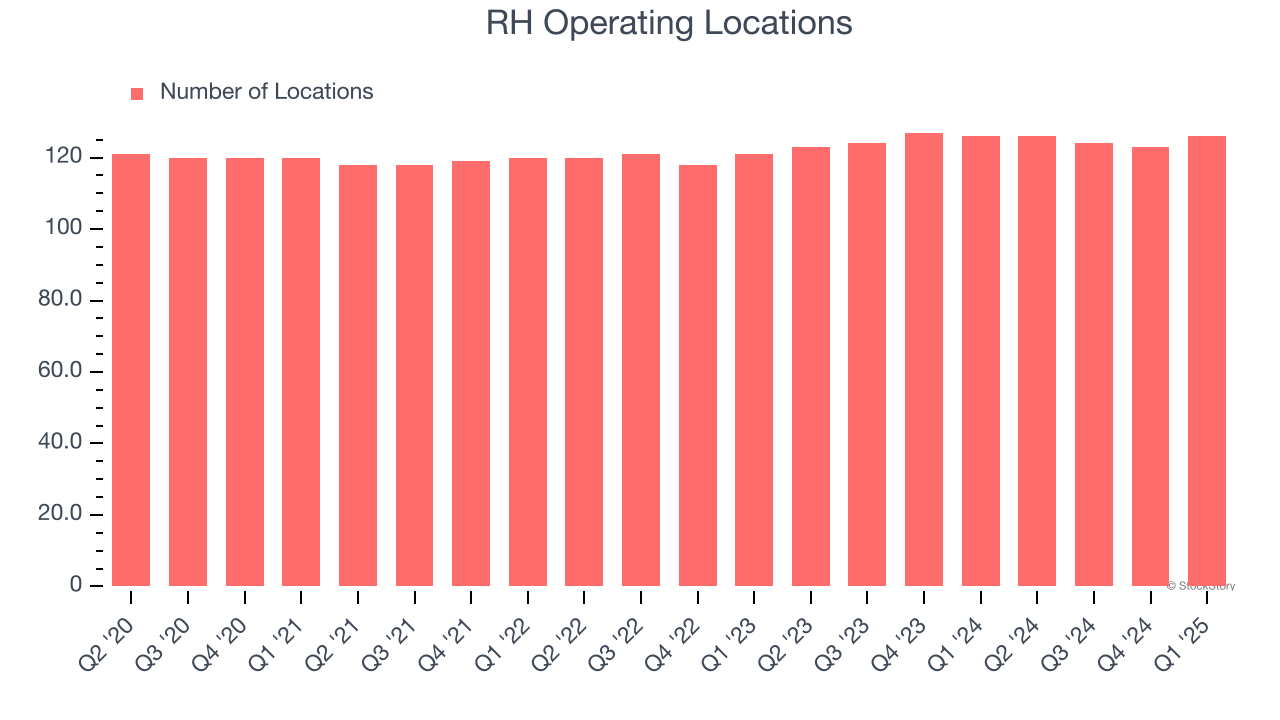
The number of stores a retailer operates is a critical driver of how quickly company-level sales can grow.
RH opened new stores quickly over the last two years, averaging 1.9% annual growth, faster than the broader consumer retail sector.
When a retailer opens new stores, it usually means it’s investing for growth because demand is greater than supply, especially in areas where consumers may not have a store within reasonable driving distance.
Note that RH reports its store count intermittently, so some data points are missing in the chart below.
Same-Store Sales
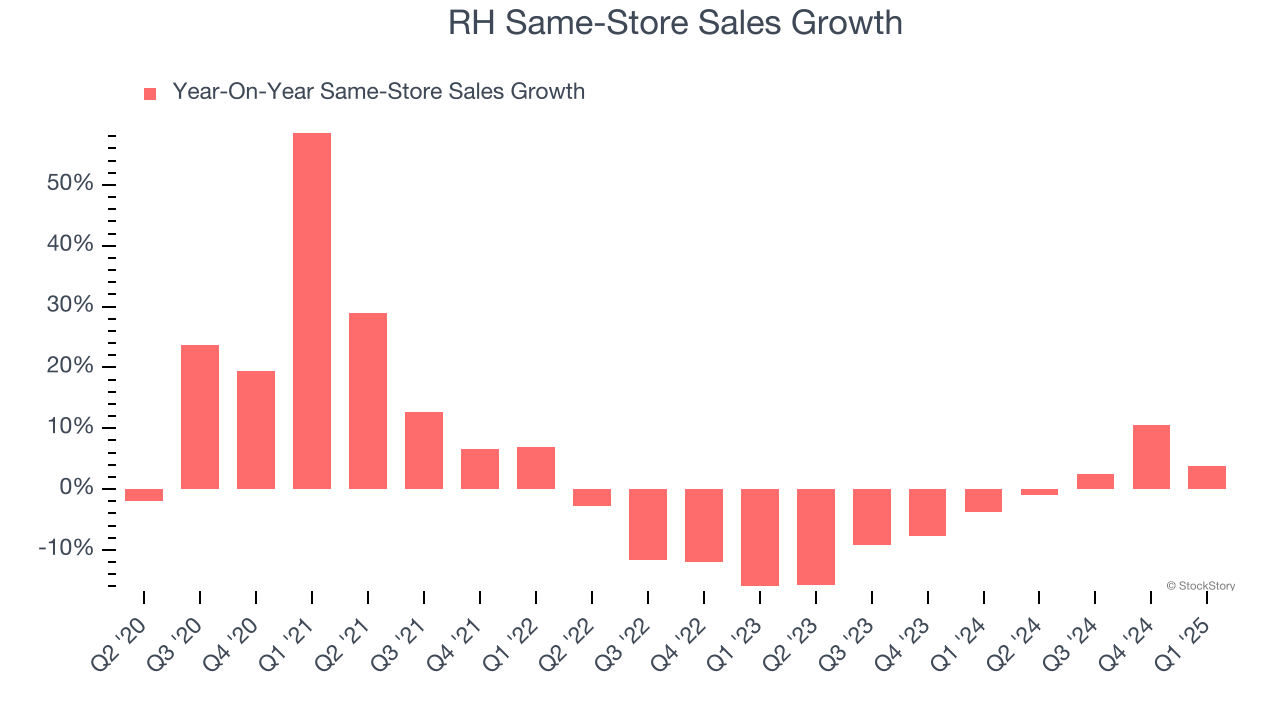
The change in a company's store base only tells one side of the story. The other is the performance of its existing locations and e-commerce sales, which informs management teams whether they should expand or downsize their physical footprints. Same-store sales gives us insight into this topic because it measures organic growth for a retailer's e-commerce platform and brick-and-mortar shops that have existed for at least a year.
RH’s demand within its existing locations has barely increased over the last two years as its same-store sales were flat. RH should consider improving its foot traffic and efficiency before expanding its store base.
Note that RH reports its same-store sales intermittently, so some data points are missing in the chart below.
Key Takeaways from RH’s Q2 Results
We struggled to find many positives in these results. Its EBITDA missed and its revenue guidance for next quarter fell short of Wall Street’s estimates. Overall, this was a weaker quarter. The stock traded down 7.4% to $212.00 immediately following the results.
RH’s latest earnings report disappointed. One quarter doesn’t define a company’s quality, so let’s explore whether the stock is a buy at the current price. We think that the latest quarter is only one piece of the longer-term business quality puzzle. Quality, when combined with valuation, can help determine if the stock is a buy. We cover that in our actionable full research report which you can read here, it’s free.


