Over the past six months, DXC’s shares (currently trading at $14.55) have posted a disappointing 14.8% loss, well below the S&P 500’s 17.7% gain. This might have investors contemplating their next move.
Is there a buying opportunity in DXC, or does it present a risk to your portfolio? Dive into our full research report to see our analyst team’s opinion, it’s free.
Why Do We Think DXC Will Underperform?
Despite the more favorable entry price, we're swiping left on DXC for now. Here are three reasons you should be careful with DXC and a stock we'd rather own.
1. Core Business Falling Behind as Demand Declines
Investors interested in IT Services & Consulting companies should track organic revenue in addition to reported revenue. This metric gives visibility into DXC’s core business because it excludes one-time events such as mergers, acquisitions, and divestitures along with foreign currency fluctuations - non-fundamental factors that can manipulate the income statement.
Over the last two years, DXC’s organic revenue averaged 4.5% year-on-year declines. This performance was underwhelming and implies it may need to improve its products, pricing, or go-to-market strategy. It also suggests DXC might have to lean into acquisitions to grow, which isn’t ideal because M&A can be expensive and risky (integrations often disrupt focus). 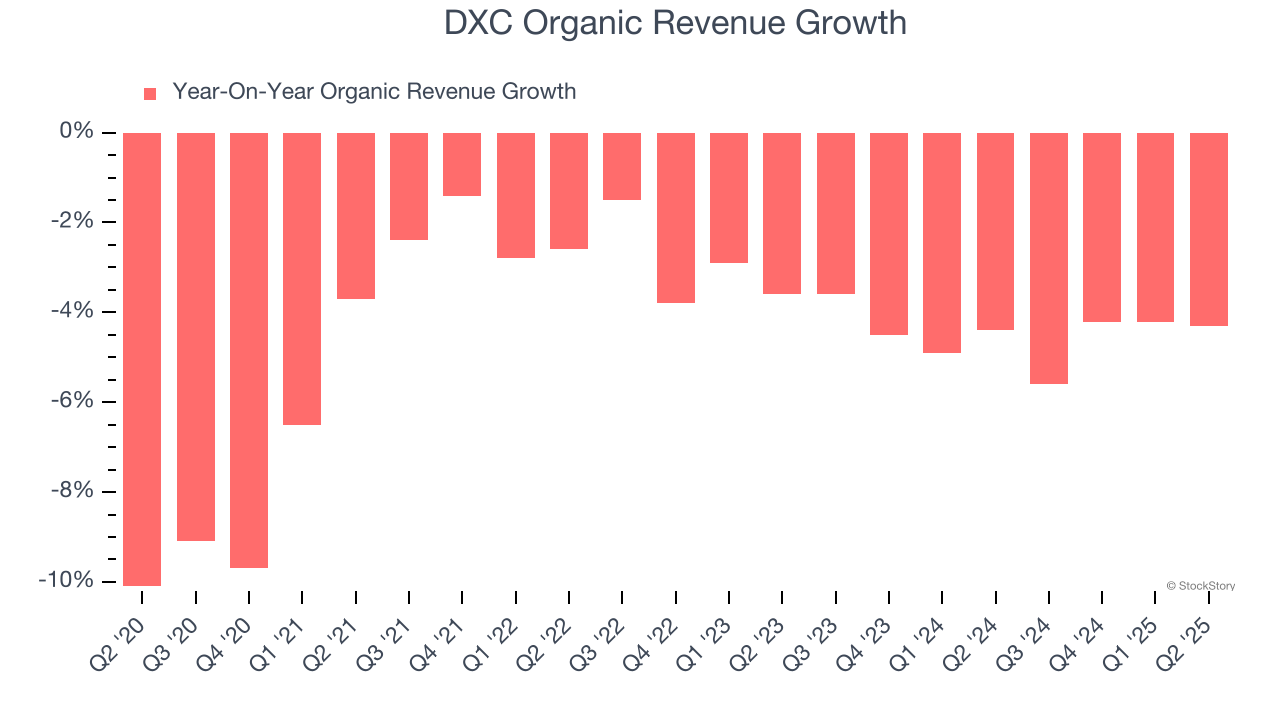
2. EPS Trending Down
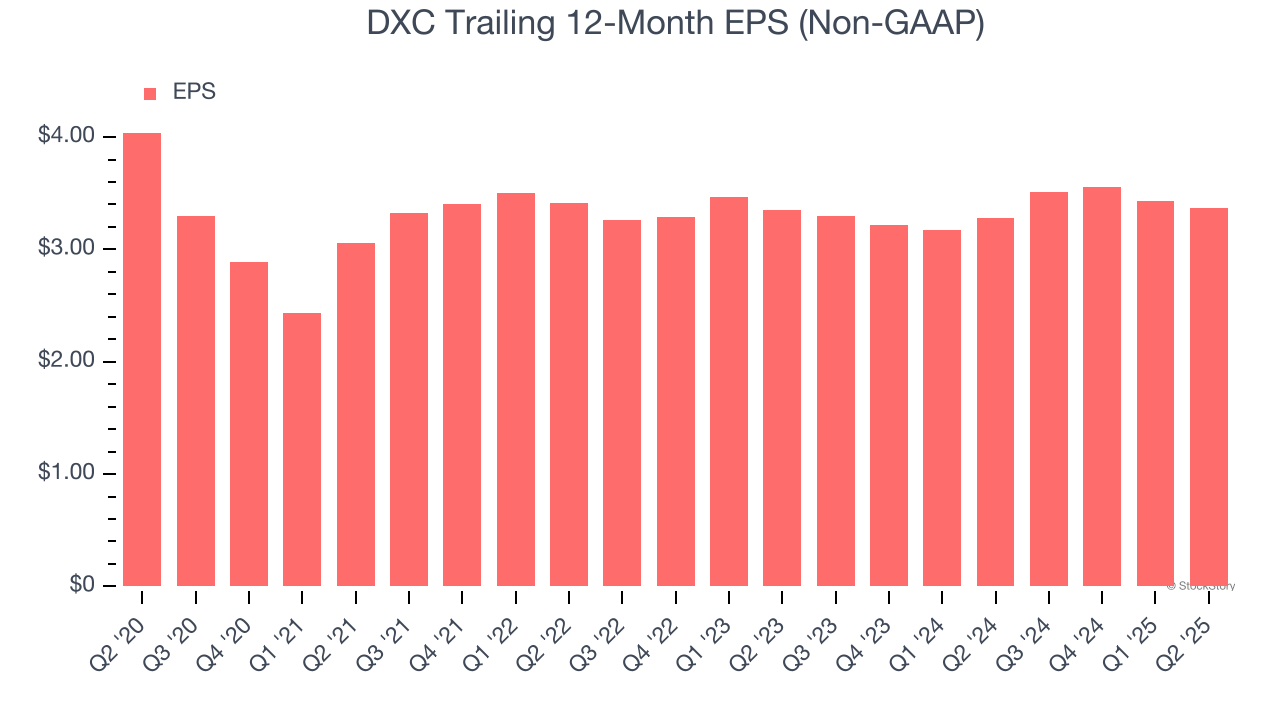
We track the long-term change in earnings per share (EPS) because it highlights whether a company’s growth is profitable.
Sadly for DXC, its EPS and revenue declined by 3.6% and 7.8% annually over the last five years. We tend to steer our readers away from companies with falling revenue and EPS, where diminishing earnings could imply changing secular trends and preferences. If the tide turns unexpectedly, DXC’s low margin of safety could leave its stock price susceptible to large downswings.
3. Previous Growth Initiatives Haven’t Impressed
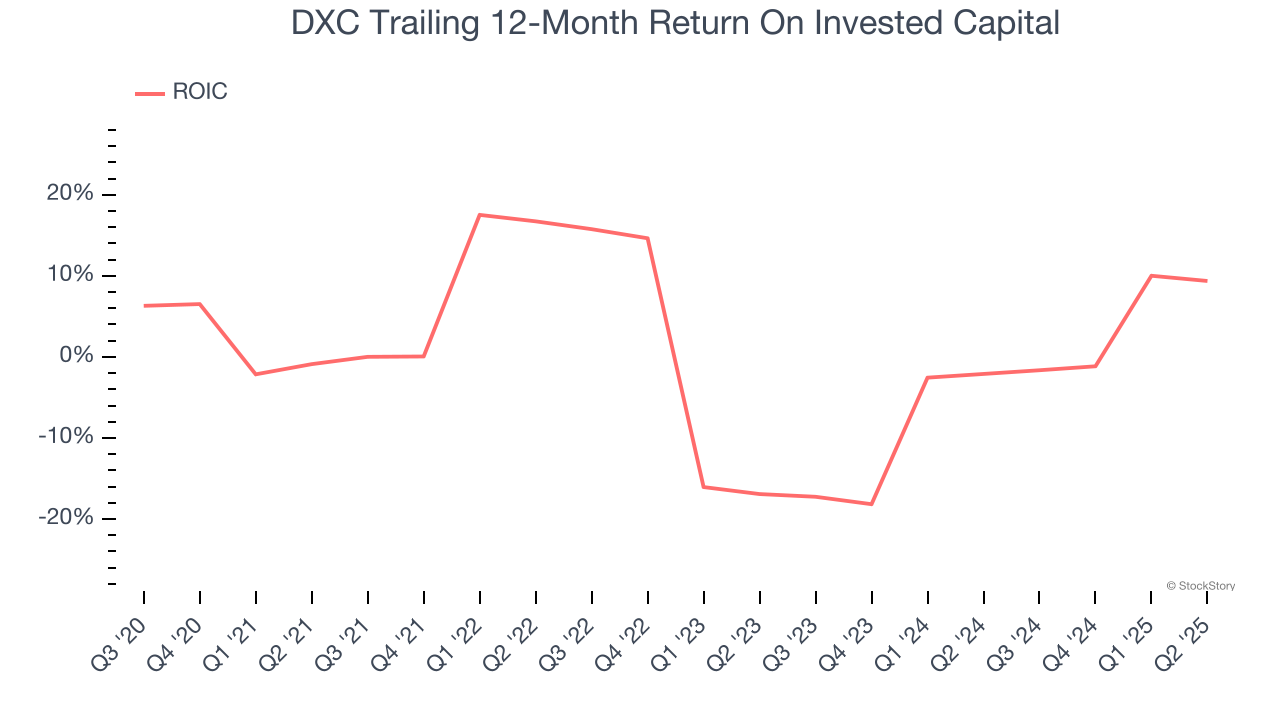
Growth gives us insight into a company’s long-term potential, but how capital-efficient was that growth? A company’s ROIC explains this by showing how much operating profit it makes compared to the money it has raised (debt and equity).
DXC historically did a mediocre job investing in profitable growth initiatives. Its five-year average ROIC was 1.2%, lower than the typical cost of capital (how much it costs to raise money) for business services companies.
Final Judgment
DXC doesn’t pass our quality test. Following the recent decline, the stock trades at 4.7× forward P/E (or $14.55 per share). While this valuation is optically cheap, the potential downside is huge given its shaky fundamentals. There are more exciting stocks to buy at the moment. We’d recommend looking at a fast-growing restaurant franchise with an A+ ranch dressing sauce.
Stocks We Like More Than DXC
Trump’s April 2025 tariff bombshell triggered a massive market selloff, but stocks have since staged an impressive recovery, leaving those who panic sold on the sidelines.
Take advantage of the rebound by checking out our Top 9 Market-Beating Stocks. This is a curated list of our High Quality stocks that have generated a market-beating return of 183% over the last five years (as of March 31st 2025).
Stocks that made our list in 2020 include now familiar names such as Nvidia (+1,545% between March 2020 and March 2025) as well as under-the-radar businesses like the once-micro-cap company Kadant (+351% five-year return). Find your next big winner with StockStory today.
StockStory is growing and hiring equity analyst and marketing roles. Are you a 0 to 1 builder passionate about the markets and AI? See the open roles here.