Fortune Brands currently trades at $61.21 per share and has shown little upside over the past six months, posting a small loss of 3.8%. The stock also fell short of the S&P 500’s 15.9% gain during that period.
Is now the time to buy Fortune Brands, or should you be careful about including it in your portfolio? Get the full stock story straight from our expert analysts, it’s free.
Why Do We Think Fortune Brands Will Underperform?
We're sitting this one out for now. Here are three reasons you should be careful with FBIN and a stock we'd rather own.
1. Core Business Falling Behind as Demand Declines
Investors interested in Home Construction Materials companies should track organic revenue in addition to reported revenue. This metric gives visibility into Fortune Brands’s core business because it excludes one-time events such as mergers, acquisitions, and divestitures along with foreign currency fluctuations - non-fundamental factors that can manipulate the income statement.
Over the last two years, Fortune Brands’s organic revenue averaged 3.8% year-on-year declines. This performance was underwhelming and implies it may need to improve its products, pricing, or go-to-market strategy. It also suggests Fortune Brands might have to lean into acquisitions to grow, which isn’t ideal because M&A can be expensive and risky (integrations often disrupt focus). 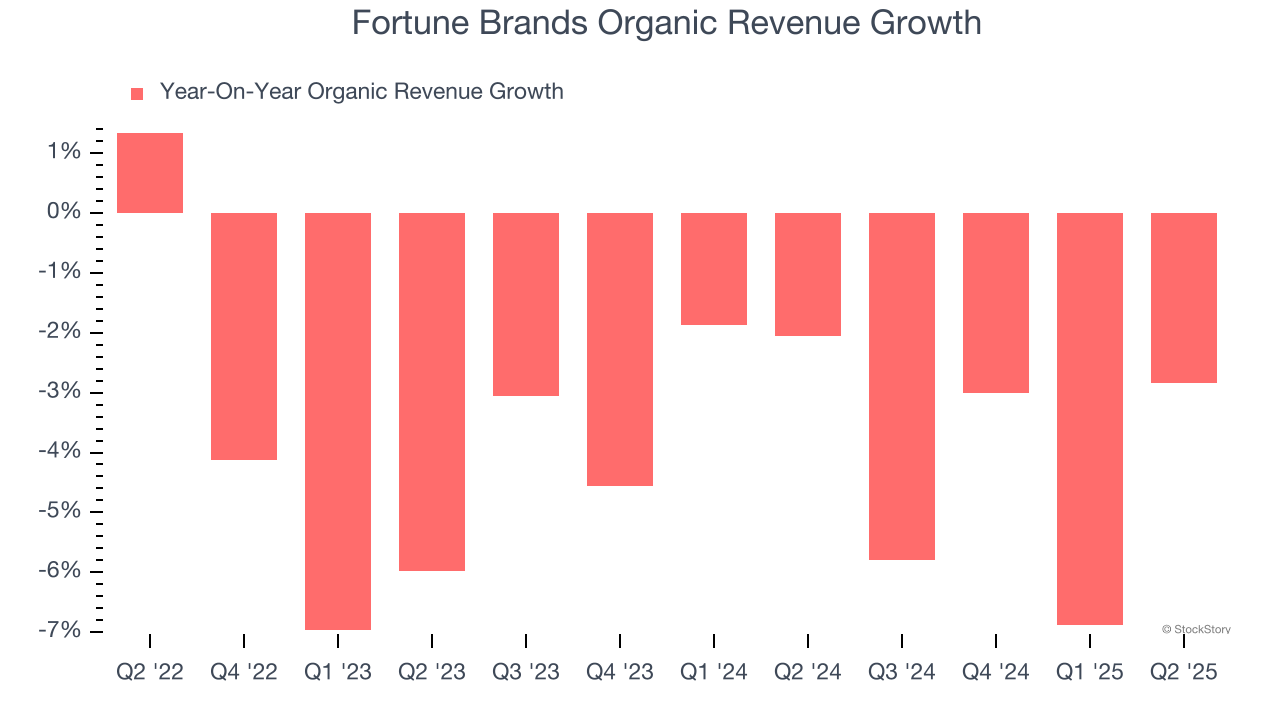
2. EPS Growth Has Stalled
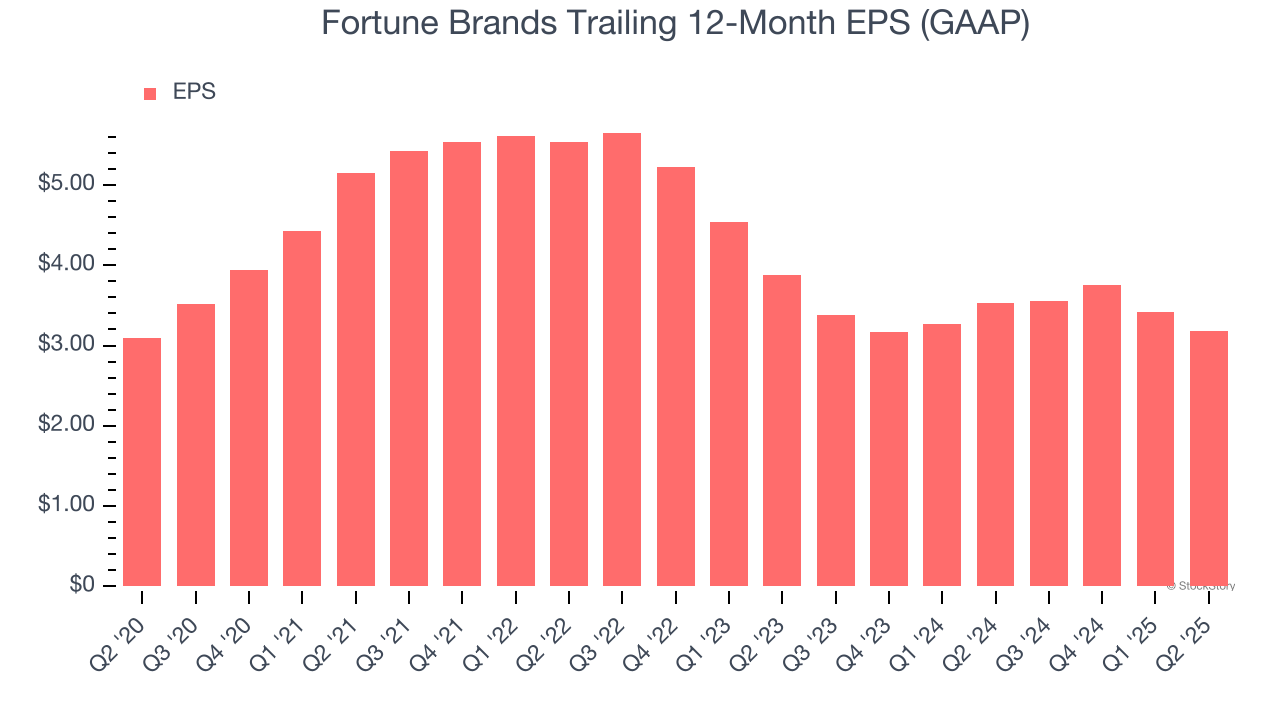
Analyzing the long-term change in earnings per share (EPS) shows whether a company's incremental sales were profitable – for example, revenue could be inflated through excessive spending on advertising and promotions.
Fortune Brands’s flat EPS over the last five years was below its 5.9% annualized revenue growth. This tells us the company became less profitable on a per-share basis as it expanded.
3. Free Cash Flow Margin Dropping
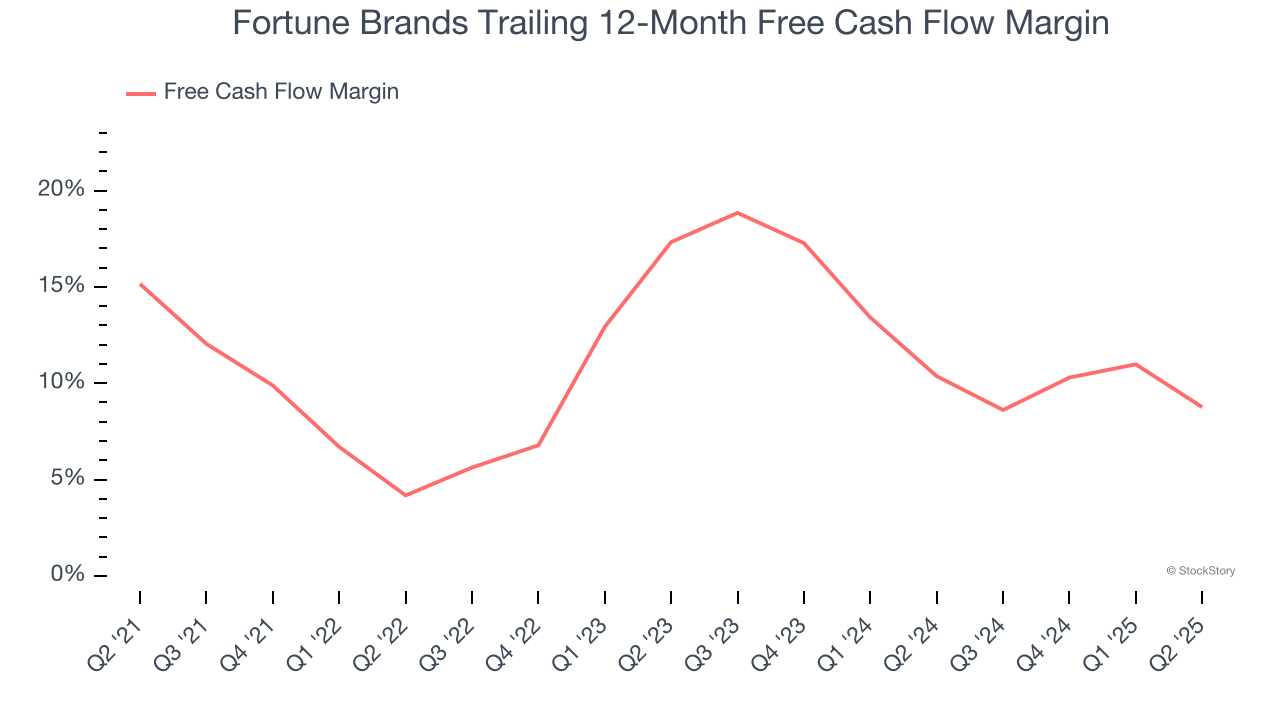
If you’ve followed StockStory for a while, you know we emphasize free cash flow. Why, you ask? We believe that in the end, cash is king, and you can’t use accounting profits to pay the bills.
As you can see below, Fortune Brands’s margin dropped by 6.4 percentage points over the last five years. Continued declines could signal it is in the middle of an investment cycle. Fortune Brands’s free cash flow margin for the trailing 12 months was 8.8%.
Final Judgment
Fortune Brands falls short of our quality standards. With its shares underperforming the market lately, the stock trades at 15× forward P/E (or $61.21 per share). This valuation is reasonable, but the company’s shaky fundamentals present too much downside risk. There are better stocks to buy right now. We’d suggest looking at a dominant Aerospace business that has perfected its M&A strategy.
High-Quality Stocks for All Market Conditions
Donald Trump’s April 2025 "Liberation Day" tariffs sent markets into a tailspin, but stocks have since rebounded strongly, proving that knee-jerk reactions often create the best buying opportunities.
The smart money is already positioning for the next leg up. Don’t miss out on the recovery - check out our Top 5 Strong Momentum Stocks for this week. This is a curated list of our High Quality stocks that have generated a market-beating return of 183% over the last five years (as of March 31st 2025).
Stocks that made our list in 2020 include now familiar names such as Nvidia (+1,545% between March 2020 and March 2025) as well as under-the-radar businesses like the once-small-cap company Exlservice (+354% five-year return). Find your next big winner with StockStory today.
StockStory is growing and hiring equity analyst and marketing roles. Are you a 0 to 1 builder passionate about the markets and AI? See the open roles here.